BadB
Professional
- Messages
- 1,883
- Reaction score
- 1,924
- Points
- 113
This topic is not very simple, but in my opinion it is obligatory even for beginners who have made a firm decision to take the path of information security, it is necessary to have at least a basic understanding of the issue. This topic touches on the rudimentary principles of computers, processor architecture, operating systems and their interactions. In other words, in order to be a driver, it is not at all necessary to know every detail of the car, but an understanding of the principles of its operation in general and each of the mechanisms in particular is required.
In articles about "binary" we will touch upon the most basic functions of a PC, touch on the mystery of the concept of "reverse", we will understand a lot about the assembler and the central processor of the PC.
Let's start with the wikipedia definition.
Reverse engineering (reverse engineering, reverse engineering, reverse engineering; English reverse engineering) - the study of some finished device or program, as well as documentation for it in order to understand the principle of its operation; for example, to discover undocumented features (including software bookmarks), to modify or reproduce a device, program, or other object with similar functionality, but without direct copying.
Reverse engineering with a simple example
You get a square box, on one side of the box there is a knob, by adjusting which, you set different values for the input, after fixing the knob, you can press the button and get the value on the other side of the box, which is considered an output. That is, in fact, you have a black box to which you can provide input data and receive output.
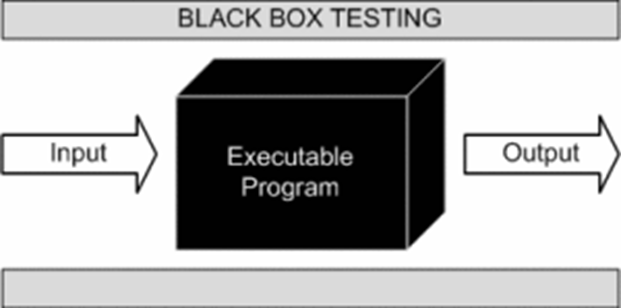
Now let's imagine that you were given only this box and there are no documents for it, that is, you don’t know how it works, you can simply supply values to the input and receive values at the output, you don’t understand how they are related, but you want to figure it out ... What for? Well, for example, in order to make the same box or to find an error in the box - the moment when it will produce the same results for different input data, although this should not be so, or something else. Your goals may be completely different, the only important thing is that you need to understand how it works or how its individual parts work.
To solve this problem, you can use different options, for example, you can analyze the relationship between input and output data and find the formula by which they change, but here you may face a problem: suddenly there are predefined constants inside the machine that you do not know about , and to confirm your formula, you will have to check all pairs of input and output data, and there can be a lot of them.
A good solution to this problem would be to parse the box and analyze its internal structure. To parse the box, tools are needed, and they may differ depending on the tasks, however, there are basic multitasking tools. For example, using a screwdriver, you can unscrew the frame of the box, fastening the internal elements, completely disassemble it and get the necessary elements out, however, we still will not get an idea of the work of the box if we just pull everything out of it. We need to analyze the relationship of all components when they work together, ideally, to understand through which elements of the box our input values pass, how they are converted and how they are processed at various stages, in general, to fully understand the algorithms for processing our values. The best option, of course, would be a step-by-step observation of the work of the box,
It is believed that reverse engineering is the most difficult part of information security, probably it is, because in order to really carry out full-fledged research, you need to know a lot of fundamental things, from building a processor to algorithms and their implementations, so this topic is considered very difficult , but it should be noted that it is paid accordingly.

Before we go directly to the study of our first program, we will recall the basics of computer science, the operation of the CPU, the OS device and executable files, we will recall the low-level programming languages (hereinafter PL) and much more. All this is necessary so that you have at least the slightest idea and understanding of what you will have to do when researching the application.
Let's start simple
Let's repeat what a CPU (central processing unit) is and what it is for.
So, the CPU serves to execute commands by the computer, it essentially executes a number of instructions laid down in it at the stage of production of instructions, modern processors can perform a huge number of operations at once.
All processor operations are very simple, for example, add two registers (variables) or send a value to the data bus, put a value in a register, take a value from the data bus and other simple operations. The following definitions, possibly unfamiliar to you, were mentioned: register, data bus, they will be explained later.
It should be remembered that in fact the processor perceives only sequences 0 and 1, that is, it works at a very low level and operates only with binary code.
Depending on the architecture, the command lengths can be different, can have a fixed length (the so-called RISC architecture), or have a non-fixed command length (for example, x86, x86-64). It is difficult for a person to perceive just numbers and consider them as commands; he needs a higher abstraction, which is precisely the assembly language.
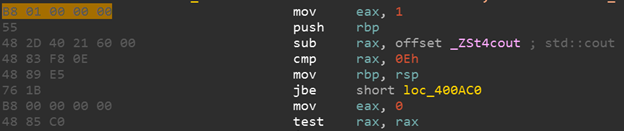
Assembly language is different for different processor architectures. The assembly language is directly related to the binary codes of the processor instructions, that is, each assembly language instruction has a one-to-one direct correspondence with the processor opcode (an opcode is an operating code, which is quite often used to describe one processor instruction). Let's see an example. We have a command in assembly language for the x86-64 architecture:
mov eax, 1 - which means put the value 1 in the eax register
In hexadecimal notation of opcodes, this command will look like this:
B8 01 00 00 00
It can be seen that the assembler presentation is more convenient for humans and allows you to better understand what is happening in a given piece of code.
In the image below, on the left, you can see the hexadecimal representation of the opcodes, and on the right, the assembly language representation.
Output
Processor, structure
The processor, in addition to the control unit and the ALU (arithmetic logic unit), also contains a memory device that includes registers - small cells of ultra-fast random access memory (RAM), which are used by the processor itself to perform any operations, depending on the architecture, the size of the cells , their number and common names are changing. There are also general registers and special registers. In fact, you can make a pretty big simplification and just think of registers as typeless, fixed-size variables that can be accessed instantly.
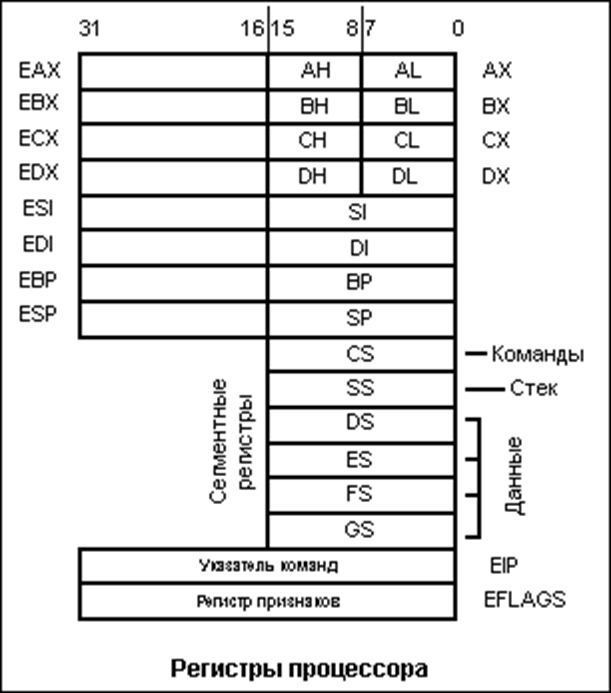
For a basic understanding of registers, I hope this information is enough, but I recommend that you familiarize yourself with this topic in more detail (links: https://en.wikipedia.org/wiki/Proce...en.wikipedia.org/wiki/Central_processing_unit).
Executable file format
Different operating systems have different executable file formats: for Windows it is the PE format, for Linux it is the ELF format, for OS X it is the Mach-O format. What does this mean in practice? If we have the same source code for a program on 3 different OSes, its compiled form will be different.
That is, a compiled program from the same source code on the same processor, but for different operating systems, will be different in each case. It is not possible to run a program compiled under Linux on Windows without using special tools. All this happens due to the fact that each operating system has its own executable file format. A format is a set of specific rules for constructing an executable file, for example, the header must contain a certain signature at such and such a position, then there is the size of the sections, then the sections themselves.
The file is built according to certain unified rules so that the OS, when starting the file, can correctly load it into RAM and transmit the correct instructions to the CPU that are in this file, and the OS will also provide the executable file with the necessary libraries, data, etc. The OS will understand all this from the content of the file, since it is built according to the rules of the executable file format for this OS. I also advise you to familiarize yourself with the formats of executable files, for example, the ELF format ( https://ru.wikipedia.org/wiki/Executable_and_Linkable_Format ).
Compilation
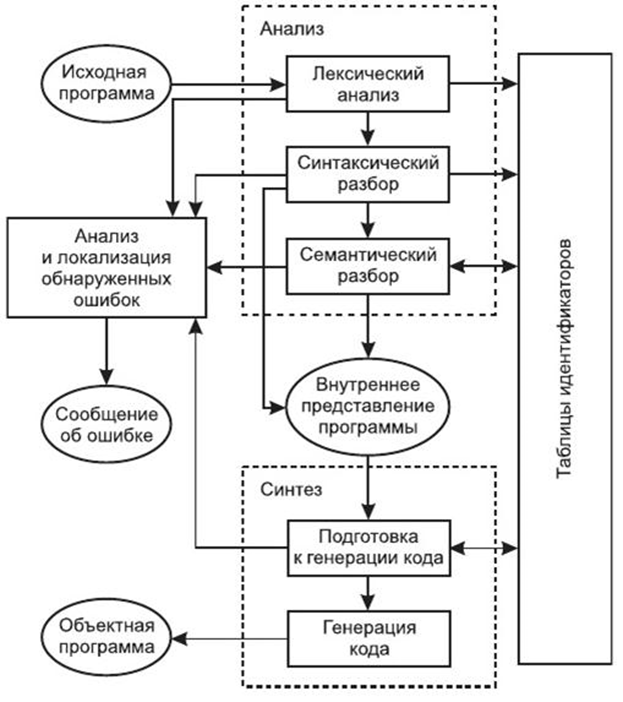
The process of converting source code on any high or medium level compiled language into machine code is called compilation. In essence, this is the transformation of our file with the source code, for example, in the C language, into an executable file under Windows, which you can run and see how it will execute the commands we specified in the source code. Compilation theory is very complex, in some universities, whole disciplines in several semesters are devoted to this, but we only need to know some fundamental points of compilation, but if you want to delve into this area, then keep in mind that you have to learn math very well.
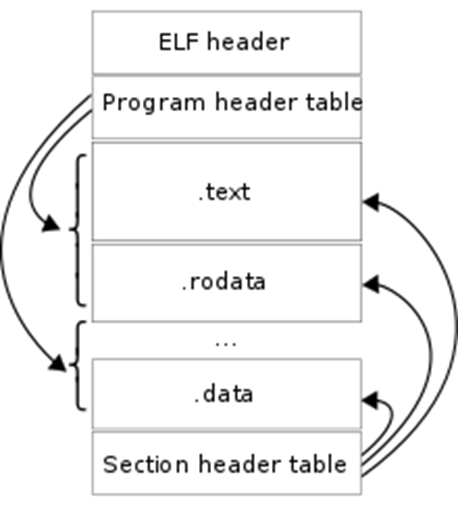
What we are interested in for our purposes: Firstly, compilation is a unidirectional process that cannot be completely reliably reversed, that is, using the available machine instructions, we will not be able to get the code in C or C++, since the compilation process is a process with losses. Secondly, if you want to make any changes to the program and edit the source code, then to make these changes to the compiled program, you need to recompile it. Thirdly, the compiled program lacks such concepts as variables, functions, loops, etc., a compiled program is a set of machine instructions. Perhaps these are the main points that we need. A relatively complete compilation scheme is shown in the figure below.
Disassembling
The process of converting (translating) machine codes into program text in assembly language is called disassembly. If you scroll through the lecture a little higher, you will notice that when we described machine codes, we took into account that one instruction in assembly language corresponds to each machine code, respectively, we can translate machine code into assembly code, which is more convenient to parse than sequences of zeros and units. This task is solved today by only a few tools: IDA Pro and radare2 (only for Linux). IDA Pro is the undoubted leader in this area, but it is paid, and the free versions have extremely reduced functionality, but we will still use it as the main research tool, because it has a wide range of functions, in addition to the main function - disassembly.
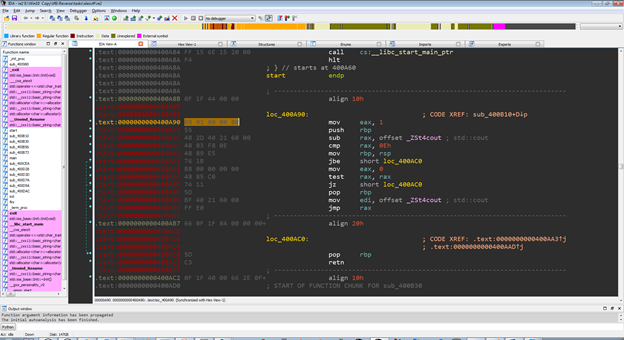 The image shows the IDA Pro disassembler interface
To understand how a program is executed, it is necessary to understand the architecture of modern computers. Modern computers are built according to the principles of von Neumann architecture:
1) The principle of homogeneity of memory.
This principle says that both program data and commands (program code) are stored in memory at the same time. There was another version of this principle in Harvard architecture. In it, data and instructions were stored separately from each other.
2) The principle of targeting.
Program memory can be thought of as a sequence of cells numbered with integers, and each cell can be read from memory or written to it by simply referring to it by its number.
3) The principle of programmed control.
Program execution is controlled by a series of instructions, these instructions are executed one after the other until a special instruction is executed, such as a conditional branch, an unconditional branch, or a function call.
4) The principle of binary coding.
All information (data and commands) is encoded in binary numbers.
Briefly about memory segmentation:
The RAM used in programs written in C / C++ is divided into two types of areas:
• Data segments
• Code segments (text segments)
The code segments contain the program code. Typically, these segments are write-protected, that is, the OS makes sure that the data in these segments is not changed.
Data segments contain program data (values of variables, arrays, etc.).
When the program starts, two data segments are highlighted:
• Global data segment
• Stack (for local variables)
Additional memory segments can be allocated and freed during the program operation.
Accessing an address outside the allocated segments (to segments that do not belong to your program) is a runtime error (access violation, segmentation fault).
Let's take a quick look at the issue of program execution
In the compiled code of your program, each function will have a separate section. The address of the beginning of this section is the address of the function, the address that will be substituted in the place where your function is called.
The body of the function corresponds to the sequence of processor instructions that was obtained after compilation. Working with data such as local or global variables occurs at the byte level, that is, there is no information about the types.
During execution, the address of each next instruction is stored in a special processor register IP (Instruction pointer), which points to the address of the next instruction. When instructions are executed, this register is incremented and thus instructions are executed sequentially. At the moment when any special instruction (conditional / unconditional jump, function call) is encountered, the IP changes and the execution of the jump to another instruction, which may be in another place in the program. For example, when calling a function, IP is translated to the address of the beginning of the function.
Consider the call stack
A call stack is a data segment used to store local variables, temporary values, return addresses, arguments passed to functions. The stack is allocated when the program starts and is usually small in size (about 4 MB).
The stack stores the local variables of the function that is currently being executed. When the function exits, the corresponding area of the stack, where the local variables of this function were located, is declared free, and another function can overwrite it.
Calling convention at a glance
Calling convention is a description of the technical features of calling subroutines, which defines:
A calling convention describes how to pass arguments to a function.
The options are:
Argument order in registers and / or stack.
The options are:
The code responsible for clearing the stack is:
A way of passing a pointer to the current object (this or self) to a function in object-oriented languages.
Options (for x86 processor running in protected mode):
The code responsible for saving and restoring the contents of the registers before and after the function call:
List of registers to be saved / restored before / after calling the function.
The calling convention can be described in the architecture ABI documentation, in the OS documentation, or in the compiler documentation.
Assembler Basics
Assembly language is a notation system used to represent, in human readable form, programs written in machine code. The assembly language allows the programmer to use alphabetic mnemonic opcodes, assign symbolic names to the computer and memory registers at his own discretion, and also set convenient addressing schemes (for example, index or indirect). In addition, it allows you to use different number systems (for example, decimal or hexadecimal) to represent numeric constants and makes it possible to mark program lines with labels with symbolic names so that they can be accessed (by name, not by address) from others. parts of the program (for example, to transfer control)
Command set:
The syntax of assembly language is determined by the instruction set of a particular processor.
Typical assembly language commands are (most examples are given for the Intel x86 architecture syntax):
• Commands for transferring data (mov, etc.)
• Arithmetic commands (add, sub, imul, etc.)
• Logical and bitwise operations (or, and, xor, shr, etc.)
• Commands to control the program execution (jmp, loop, ret, etc.)
• Commands for calling interrupts (sometimes referred to as control commands): int
• I / O commands to ports (in, out)
Some commands:
mov eax, 123; put value 123 into eax register
add eax, 321; add 321 to the value in the eax register
sub eax, 321; subtract the number 321 from the value in the eax register
jmp loc_deadbeef; unconditional jump to named label
push eax; put the value of the register eax on the stack
pop eax; get the value from the top of the stack and put it in the eax register
call strcmp; call the strcmp function
ret; return control to the calling function (the address is taken from the top of the stack)
Binary vulnerabilities
Under the binary vulnerabilities implied vulnerability contained in an executable (compiled) file. It is difficult to overestimate the severity of such vulnerabilities. For example, if such a vulnerability is found in a certain version of a popular software, then it applies to all copies of this product. You can view the differences from web application vulnerabilities. A vulnerability found in any particular web application will not be propagated to all others.
The list of typical binary vulnerabilities is presented below:
1) Buffer overflow (stack, heap)
2) Format string vulnerability
3) Integer overflow
4) Use after free
5) RCE
Buffer overflow.
Buffer overflows usually occur due to improper handling of data received from the outside and memory, in the absence of tight protection from the programming subsystem (compiler or interpreter) and the operating system. As a result of overflow, data located after the buffer (or before it) can be corrupted.
Buffer overflows are one of the most popular ways to hack computer systems, since most high-level languages use the stack frame technology - placing data on the process stack, mixing program data with control data (including the address of the start of the stack frame and the return address from the executed function) ...
A buffer overflow can cause a program to crash or hang, leading to a denial of service (DoS). Certain types of overflows, for example, a stack frame overflow, allow an attacker to download and execute arbitrary machine code on behalf of a program and with the rights of the account under which it is running.
A program that uses a vulnerability to destroy the protection of another program is called an exploit. The most dangerous are exploits designed to gain access to the superuser level or, in other words, to elevate privileges. The buffer overflow exploit accomplishes this by passing specially crafted input data to the program. Such data overflows the allocated buffer and changes the data that follows that buffer in memory.
Imagine a hypothetical system administration program that runs with superuser privileges for example, changing user passwords. If the program does not check the length of the new password entered, then any data, the length of which exceeds the size of the buffer allocated for storing it, will simply be written over what was after the buffer. An attacker can insert machine language instructions into this area of memory, for example, shellcode that performs any action with superuser privileges - adding and removing user accounts, changing passwords, changing or deleting files, etc. If execution in this area of memory allowed and in the future the program will transfer control to it, the system will execute the attacker's machine code located there.
Well-written programs should check the length of the input to make sure it is no larger than the allocated data buffer. However, programmers often forget this. If the buffer is located on the stack and the stack "grows down" (for example, in the x86 architecture), then using a buffer overflow, you can change the return address of the function being executed, since the return address is located after the buffer allocated by the function being executed. Thus, it is possible to execute an arbitrary section of machine code in the address space of the process. It is possible to use a buffer overflow to mangle the return address even if the stack is "growing up" (in this case, the return address is usually in front of the buffer).
Even experienced programmers can find it difficult to determine how much a buffer overflow can be a vulnerability. This requires in-depth knowledge of the computer architecture and the target program. It has been shown that even minor overflows such as writing a single byte out of the buffer can present vulnerabilities.
Buffer overflows are widespread in programs written in relatively low-level programming languages such as assembly language, C and C ++, which require the programmer to independently manage the size of the allocated memory. Troubleshooting buffer overruns is still a poorly automated process. Formal program verification systems are not very effective in modern programming languages.
Many programming languages, such as Perl, Python, Java, and Ada, manage memory allocation automatically, making buffer overflow errors unlikely or impossible. Perl provides automatic resizing of arrays to avoid buffer overflows. However, runtime systems and libraries for such languages can still be subject to buffer overflows due to possible internal errors in the implementation of these validation systems. Several software and hardware / software solutions are available on Windows that prevent code from executing outside of a buffer overflow if an overflow occurs. Among these solutions is DEP in Windows XP SP2.
In the Harvard architecture, executable code is kept separate from data, making such attacks nearly impossible.
EXAMPLE CODE.
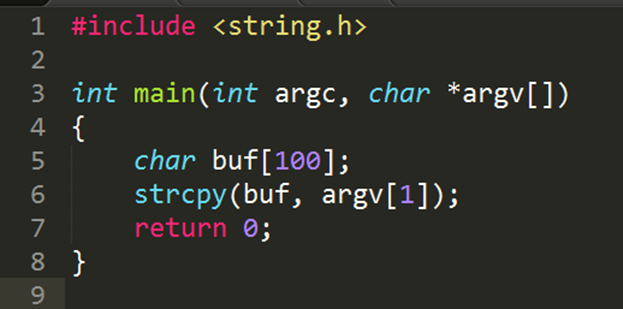
The unsafe strcpy function is used, which allows writing more data than the array allocated for it can hold. If you run this program on Windows with an argument longer than 100 bytes, the program will most likely crash and the user will receive an error message.
The following program is not affected by this vulnerability:
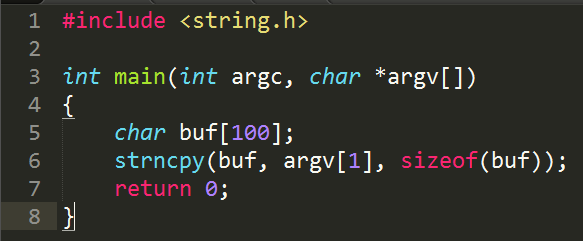
Here strcpy is replaced by strncpy, in which the maximum number of characters copied is limited by the size of the buffer.
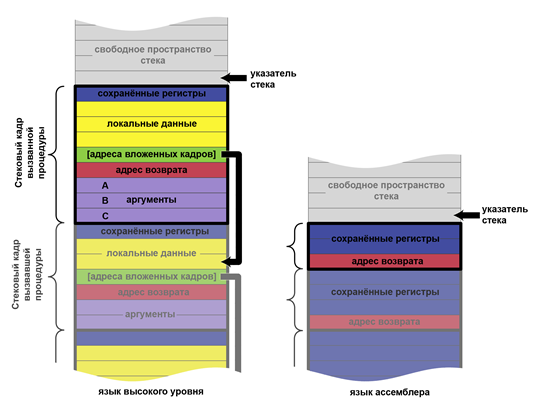
The diagrams below show how a vulnerable program can damage the stack structure.
An illustration of writing various data to a buffer allocated on the stack.
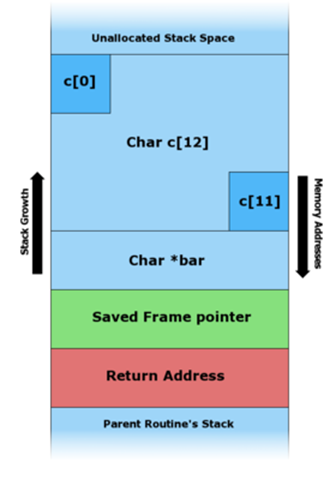
Before copying data.
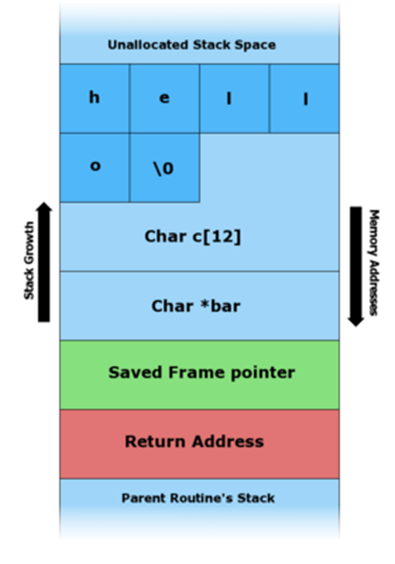
The string "hello" has been pushed onto the stack.
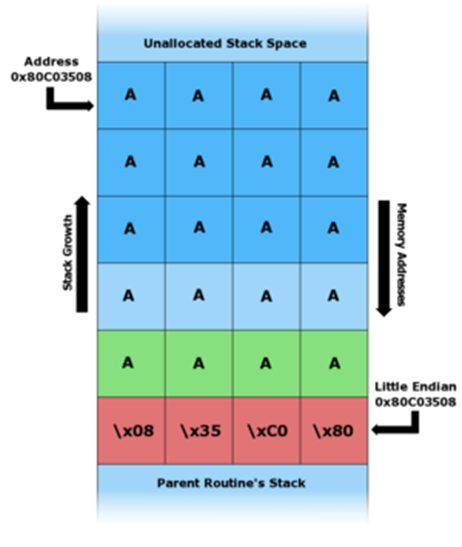
The buffer overflowed resulting in an overwrite of the return address.
In the x86 architecture, the stack grows from large addresses to smaller ones, that is, new data is placed in front of those that are already on the stack.
By writing data to the buffer, you can write outside its boundaries and change the data located there, in particular, change the return address.
If the program has special privileges (for example, it is run as root), the attacker can replace the return address with the shellcode address, which will allow him to execute commands on the attacked system with elevated privileges.
Buffer overflow techniques vary with architecture, operating system, and memory area. For example, the heap buffer overflow (used for dynamic memory allocation) is significantly different from that of the call stack.
Stacking
Also known as Stack smashing. A tech-savvy user can use a stack buffer overflow to manipulate a program for their own purposes, in the following ways:
· Overwriting a local variable located in memory next to the buffer, changing the behavior of the program in their favor.
· Overwriting the return address in the stack frame. As soon as the function completes, control is transferred to the address indicated by the attacker, usually to the memory area that he had access to change.
· Overwriting a pointer to a function or an exception handler, which will subsequently gain control.
· Overwriting a parameter from another stack frame or non-local address that is pointed to in the current context.
If the address of the user data is unknown, but it is stored in a register, the "trampolining" method can be used: the return address can be overwritten with the opcode address, which will transfer control to the memory area with user data. If the address is stored in the R register, then a jump to the command transferring control to this address (for example, call R) will cause the execution of the user-specified code. The addresses of suitable opcodes or memory bytes can be found in the DLL or in the executable itself. However, addresses usually cannot contain null characters, and the locations of these opcodes vary depending on the application and operating system. The Metasploit Project, for example, kept a database of suitable opcodes for Windows systems (currently not available).
A stack buffer overflow should not be confused with a stack overflow.
It is also worth noting that such vulnerabilities are usually found using the fuzz testing technique.
Heap exploitation
A buffer overflow in the heap data area is called a heap overflow and is exploited in a different way than a stack buffer overflow. Heap memory is dynamically allocated by the application at runtime and usually contains program data. Exploitation is done by corrupting this data in special ways to force the application to overwrite internal structures such as pointers in linked lists. A common exploit technique for heap buffer overflows is to overwrite heap references (such as the malloc function metadata) and use the resulting modified pointer to overwrite the program function pointer.
The JPEG image processing vulnerability in Microsoft's GDI + is an example of a heap buffer overflow vulnerability.
This is theory. In the following lessons, we are going to practice.
Let's continue the topic of "binaries" and reverse. This is the second part of the tutorial.
Today we will have a little practice and fun (and not so much fun with everyone's favorite IDA disassembler, or in common people, Aunt Ida. In this article, we will look at the basics of disassembly and get acquainted with the interface of the most popular, although not the only program, that helps with this.
I want to note that we have already considered another disassembler, which in terms of functionality is comparable (and in some cases even superior) with IDA, this is Ghidra from NSA.
Before we start having fun with Ida, let's deal with the question “What is a disassembler?”.
Disassemblers and Debuggers
A disassembler is a program that allows you to convert machine code into assembly language code. This definition is rather simplified, but sufficient.
The disassembler market is not particularly full of various products. There are many different reasons for this, one of which is that there is no need for reverse engineering. If you try to break disassemblers into categories, then it would be more expedient to break them into 2 classes: interactive and non-interactive. Interactive disassemblers are those that allow you to interact with yourself to improve output and simplify analysis. Such disassemblers are radare2 and IDA PRO.
Non-interactive ones display the result of their work and do not allow you to conveniently interact with themselves to improve the output - ObjDump, and other old disassemblers.
What is a debugger?
A debugger (or debugger) is a computer program with which you can debug in programs (compiled, interpreted, with a virtual machine).
Debugging is the process of tracing, tracking, setting, and changing the values of variables during code execution. Also setting and removing so-called "breakpoints".
Tracing is the process of stepping through a program. In trace mode, the programmer sees the sequence of command execution and the values of variables at a given step in the program execution, which makes it easier to detect errors. Tracing can be started and ended anywhere in the program, program execution can stop at each command or at breakpoints, tracing can be performed with and without entry into procedures, and also performed in the reverse order (a step back).
Let's summarize
A debugger is a program that launches another program in itself and allows you to execute it step by step, while monitoring all the important values of the program during execution (variables, memory), while being able to change them and change the program flow.
What kind of debuggers are there?
List of well-known popular debuggers (some of them are no longer supported and outdated, for example SoftIce)
Debugger types
Debuggers are different, this can be understood from the list above. They can be conditionally divided into the following categories:
Debugger for reverse engineering
For reverse engineering purposes, the user-space and kernel-space debugger is most often used, since there is usually no access to the source code. If we consider debuggers for Linux, then this is gdb, with various extensions.
There are several solutions for Windows, for example Immunity Debbuger as user-spcae and WinDbg as a kernel debugger.

This is what Immunity Debugger looks like.
For reverse engineering and searching for vulnerabilities, the debugger plays a fairly large role. Using it, you can determine what a particular function is doing, how the stack or heap is overwritten, where this or that function is called, and much more.
IDA Pro
IDA PRO is considered to be the main disassembler. This tool has tremendous potential for the researcher. This disassembler supports a huge number of architectures, which makes it possible to successfully conduct research on various embedded software. Also, IDA PRO is a good help for the extension, as it has its own built-in scripting language - idc, as well as a convenient API in Python, which allows you to use the power of the scripting language. In this course, IDA PRO will be considered the main disassembler.
There is a rather subtle point related to IDA PRO. The point is that the full version has a pretty decent price tag. Free versions are rather narrowly functional, and only support 2 architectures x86, x86-64. However, most aspiring researchers who do not have a job and an official license for IDA use pirated versions. On the Internet, there are many different full versions of IDA PRO, from 6.6 to 7.0. Also, in licensed versions of IDA, you can often find a joint add-on - the HexRays decompiler. This decompiler simplifies the analysis of x86, x86-64 applications.
IDA Pro is a rather difficult tool to fully master, due to the large number of available functions and the ambiguity of some functions. However, basic work skills can be acquired after a few hours of work.
Having fun with Aunt ID
To download a file (a file means an executable file or, for example, some kind of firmware) into IDA Pro, you can use 2 methods. The first is that after starting IDA Pro, you can transfer the required file to the IDA window. The second way is to find the “File” tab in the IDA control panel, find the “Open” option in the drop-down menu, then find the required file and open it.
Uploading a file to IDA works differently depending on the file. If the file contains little code and data, then loading and automatic analysis will go almost imperceptibly. It should also be noted that for known formats of executable files, automatic analysis will be extremely successful, since IDA will be able to correctly parse all headers and unload all data correctly. What does it do? All functions and links will be successfully recognized and restored. That is, we can reliably say that this function uses the given string from the data segment.
However, sometimes you can find files protected by packers, various technologies and obfuscators. In this case, the result of the automatic IDA analysis would be rather useless. Without user assistance, packed files will not be recognized correctly.
After automatic analysis in the IDA Pro window, a graph of the order of procedure calls will be displayed (see the figure below); to switch to the mode of listing the assembler code, press “Space”.
One of the main conveniences and advantages of IDA is the graphical display of branches in the code of functions, which allows you to split the function into logical blocks and more conveniently observe the conditions for transition to a particular block of code.

Also, it is worth noting the display of information about the use of the stack by the investigated function. Before the first command of a function, you can most often notice an indication of the number of used local variables allocated on the stack and the number of arguments, as well as see the offsets at which local variables are on the stack.

Due to the multifunctionality of IDA, there are a large number of so-called "hot keys" that allow you to quickly perform certain actions. This list is quite extensive and it is only advisable to study it fully if you are going to do reverse engineering quite seriously. However, you still need to know some of these combinations.
" Space (space)" - transition from graphical representation to text and vice versa.
" Shitf + f12 " - displays a section of strings.
" A" - converting the data on which the cursor is located into a string (convenient for converting hexadecimal constants that are ASCII table codes into a character form)
" N" - rename (function, label, variable, etc.)
" Alt + t" - search by the text displayed in the current window.
"X" - search for cross-references to the selected object (selection is done by single-clicking the LMB on the object of interest, which can be a function, line, label, etc.), one of the most frequently used keys when analyzing the code. allows you to understand where the function was called, or where the string is used.
All of the given combinations can be found in the top menu of IDA, however, searching for them and clicking with the mouse will take a lot of time compared to pressing on the keyboard.
0x00 start
; {EN} entry point, do nothing, just run _main {EN}
An article for novice "warriors of darkness", those who want to plunge into the dark side of power: reverse engineering. On our "operating table" there will be a small artisanal server that runs on the TCP / IP protocol. To analyze the communication protocol, we will be helped by the de facto standard in the field of reverse - IDA Pro.
A lot of articles on reverse engineering and IDA Pro have already been written (although not as much as on PHP), but since the reverse process is an exploratory process, thoughts on how to approach the reverse engineering task from the “other side” are useful for beginners. At least as an author, I have been guided to outline the basic practices and techniques that I talk about in the early days to all trainees and in the first couples of a reverse engineering course at university.
Ahtung! As in the process of any sex with strangers, it is recommended to use protection here! Do not run binaries on the main system, it is better to do it on a virtual machine!
Subject: crackme .
Minimum system requirements: a virtual machine with Windows 7 / 0xA installed.
0x01 mov eax, ds: __ stack_chk_guard
; {EN} Disclaimer {EN}
Almost the entire article is written in the context of the assembly language and x86 processors, so working with memory, conditional jumps (flags), instructions, etc. will be described in the context of this particular processor core. Keep in mind that although other processor architectures exist, at the time of reading this article, we will be neglecting fundamental differences.
0x10 What do we need to understand what is going on?
; {EN} Setups prerequisites for the consequent execution {EN}
For the article to be interesting and understandable, it is assumed that the reader knows:
The second thing we need is a test subject. Any executable file will do (it is a binary, it is a file with the * .exe extension for Windows), but it is recommended to take the one attached to the article. If you take your own binary, it is better if it is a file compiled for x86 (for the first time, you should not take compiled for x64 - in them the assembler is more complicated).
Third - of course, at least basic knowledge of the assembler language x86.
In order to deliberately dig into the program and reverse it, it is highly desirable to know the x86 assembly language: instructions ( mov , lea , push / pop , call , jmp, arithmetic and conditional jumps), registers and processor principles. If they are not at all, then it is strongly recommended to study at the beginning, for example:
Author's note. I want to note that when I myself was just starting to do this, the assembler looked like it continues to look like regexp (regular expressions) - like you know all the letters, but don't add up to words. However, I gradually began to understand what instructions do and what happens in the processor.
Fourth - 30 minutes of time (although maybe 30 hours) and a desire to learn.
0x20 A moment of philosophy or what is IDA Pro and why?
; {EN} Whatta hell? {EN}
It is worth noting, however, that given the ever-growing closed code base and monkey-printed code on the internetThe software is getting harder and harder to reverse manually and interactively. Because of this, code analysis tools aimed at automated processing are now actively developing - radare2 (no matter what r2 adherents say, the interactive Cutter interface is not as interactive as in IDA Pro). Moreover, IDA Pro is also very well automated with its built-in Python interpreter and API.
And yet, no matter how cool the automated analysis is, it is not automatic, that is, it cannot replace the researcher by 100%, and sooner or later the researcher needs to engage in battle. Therefore, when all the preparations are finally completed, let's start learning IDA Pro! Let's begin to gradually disassemble our experimental sample.
0x30 Looking at IDA Pro and learning the basics of its interface
; {EN}
; This function is too complex.
; Perhaps it interacts with user.
; But currently I am not sure about it.
; A lot of calls to Qt-framework.
; {EN}
0x31 Loading the binary into IDA Pro
Open IDA Pro. Before us, after all the starting windows (which can be closed immediately), the initial program window appears. All you need to do is drag and drop the binary under investigation into it. After that, in the window that appears, click the "OK" button.
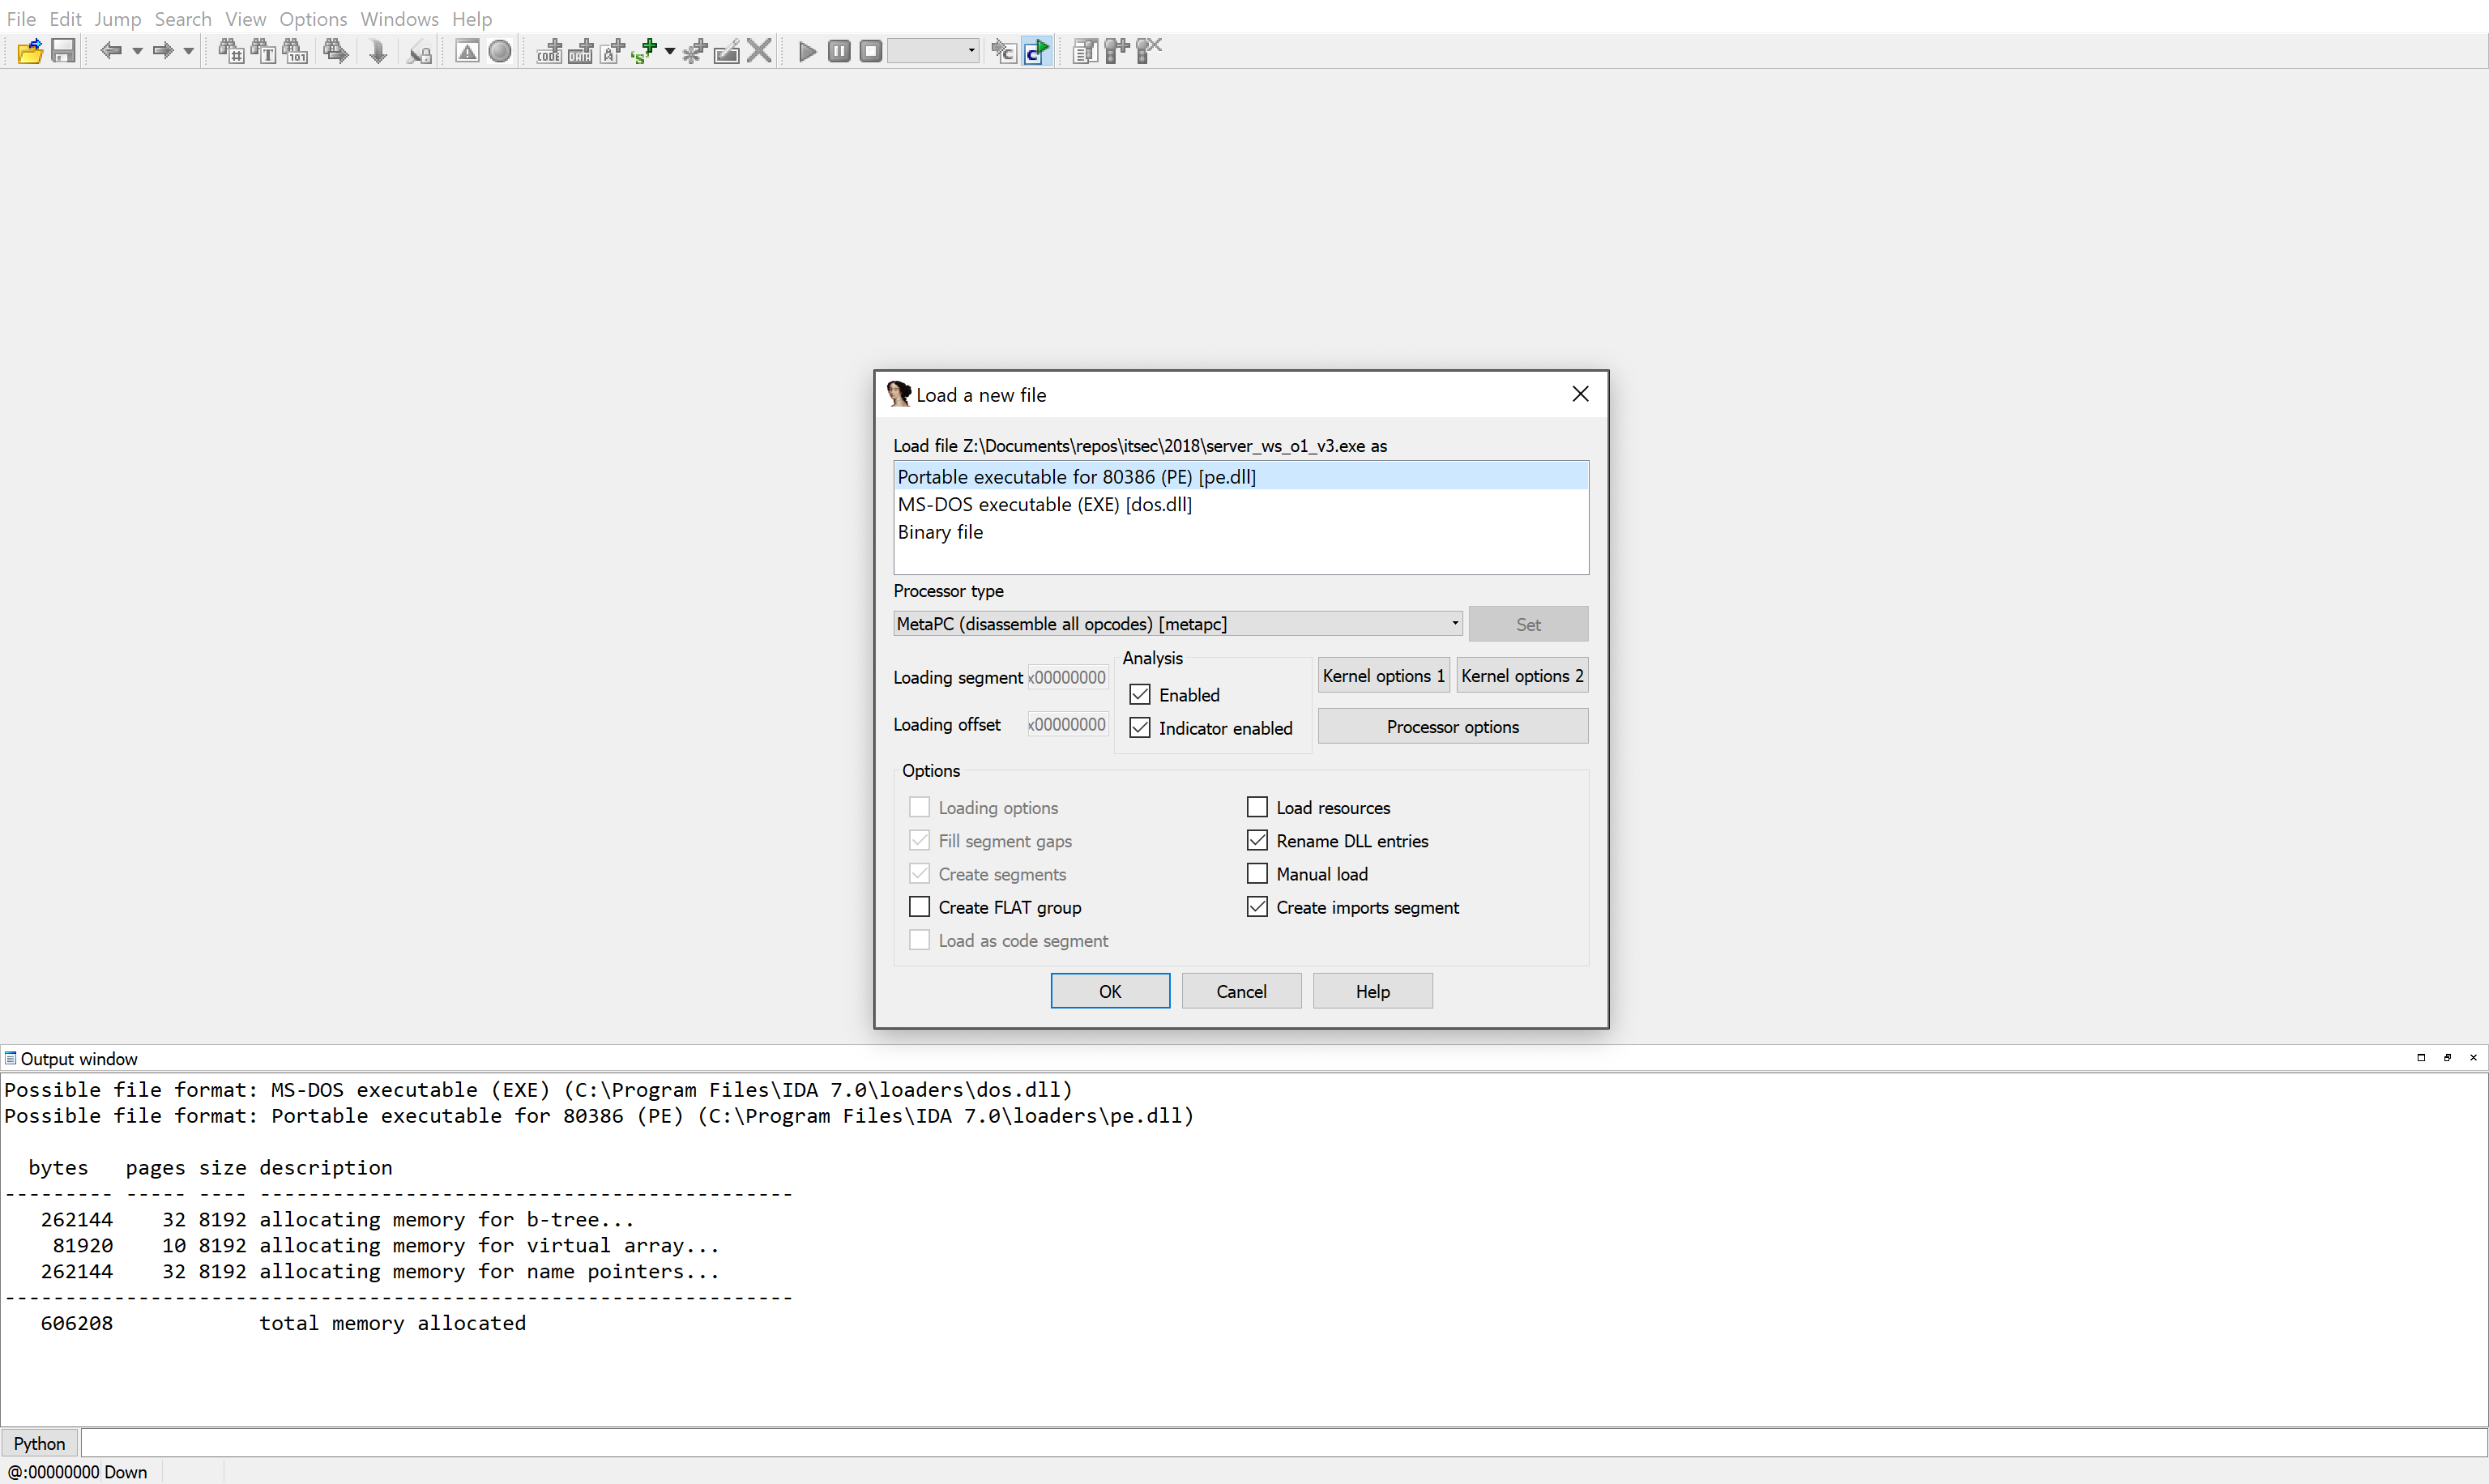
IDA Pro main window when loading a binary
In our case (if you loaded the same exe-file into IDA, which is attached to the article) you do not need to make any settings, IDA Pro itself recognizes the format of this file (PE, portable execute), but if you drop the firmware or dump from the microcircuit there memory from, for example, a router, everything will be much more complicated.
There is no single standard for storing firmware. Each manufacturer chooses the format of the update file for himself, which gives some protection against reverse engineering, since in order to get to the code, you first have to parse this format.
After being extracted from the update file, the code itself can be located at any address in the device's memory. Finding a code base point is a separate task that deserves its own article.
As for the memory dump, the microcircuit itself may already have a file system taking into account “scrambling” (mixing blocks in flash memory in order to reduce wear and tear). Putting these blocks back together is often not the most trivial task. To restore the scrambling scheme, you need to reverse the scrambler itself.

This is what the scrambler execution flow graph looks like.
0x32 What did IDA Pro show us?
After loading the binary, IDA Pro performs its preliminary automatic analysis: it determines functions, global variables, strings - everything that can be automatically pulled out of the analyzed file. The analysis is performed by the IDA Pro processor module (not to be confused with the processor itself). In fact, this is a plugin for IDA Pro (if you wish, you can write your own in Python or C ++). In our case, IDA uses the so-called Meta PC - an x86 / x64 variant that takes into account most of the tweaks that have been added to the architecture from Intel and AMD. Automatic analysis is performed again based on the fact that there is a complete description of the file format that we uploaded to IDA, in our case the same Portable Executable. This format clearly indicates which sections are in the file, which section contains the code, where is its entry point, and in which section the data (constants or global variables). As usual, such a trick does not work with firmware, and you need to manually mark the input file (or write a loader plugin for IDA, which will be able to "crush" pieces of the firmware binary as needed, after which the IDA processor module will be able to start analyzing).
Automatic analysis under the hood is extremely complex, but for each instruction it is as follows:
It should be noted that this is a very general description of what actually happens. It is presented in order to give a basic understanding of what automatic analysis performed in IDA is.
A few words about how IDA Pro stores the reverse result. After or during automatic analysis, the “project” can be saved (if, of course, you have the full version). IDA stores the result of the analysis in the form of a special database with its own structure (no, this is not the fancy MongoDB) on the hard disk. It is a single file with the extension .idb (or .i64).
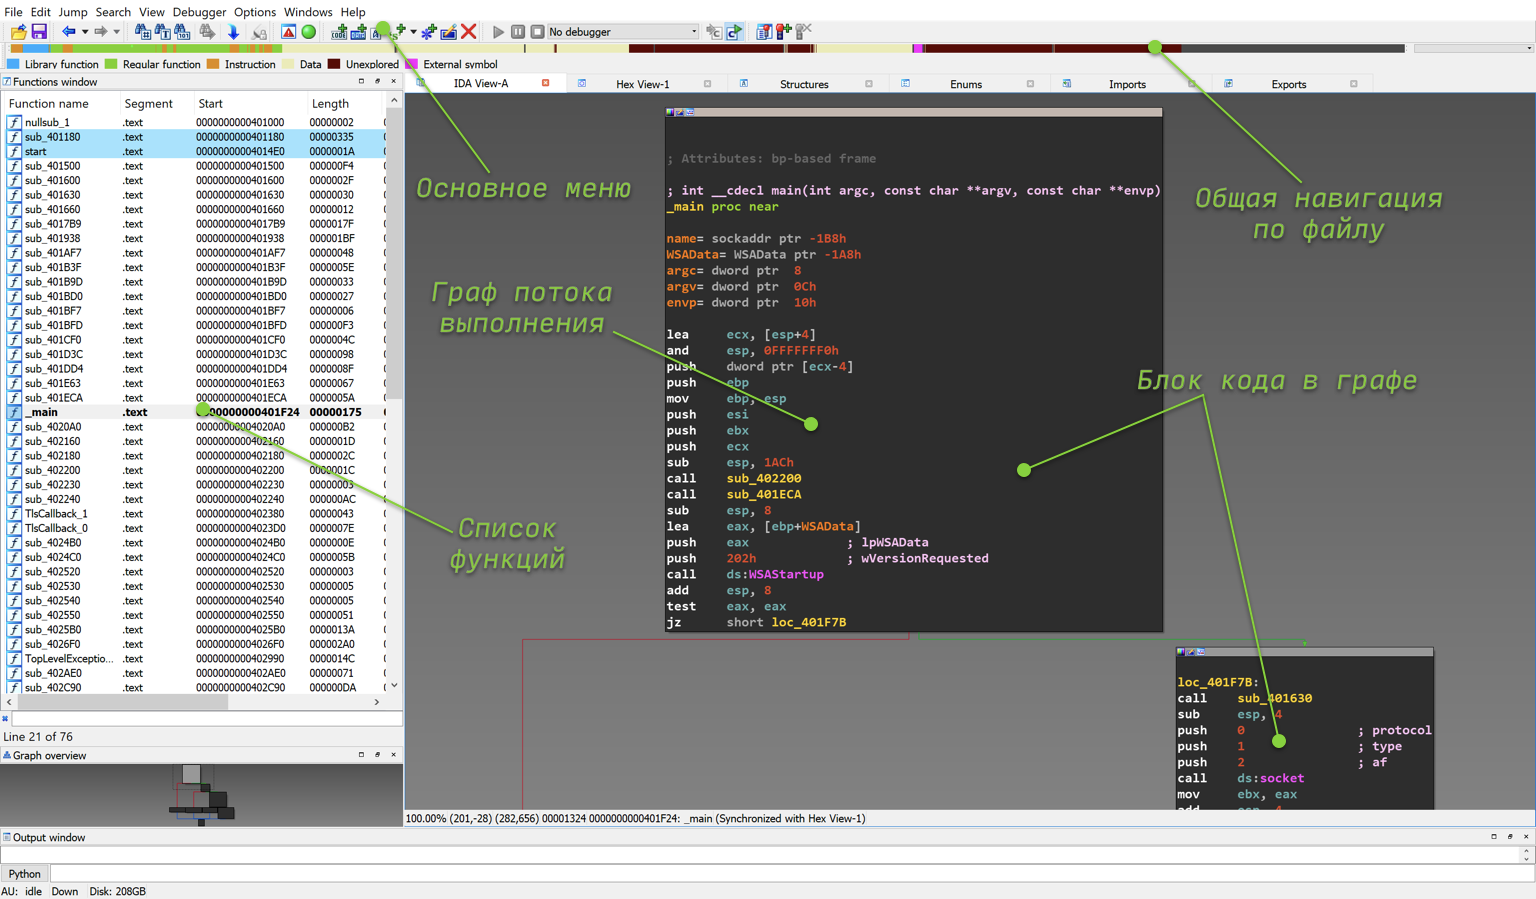
After the automatic analysis is complete, you will see a window similar to the one in the figure below. The main elements that a novice researcher should pay attention to are labeled on the screenshot itself. The completion of the automatic analysis can be determined by the AU: Idle inscription in the lower left corner of the IDA Pro.
The GUI of IDA Pro is written in Qt, so if you have ever worked with applications written in Qt, the same rules apply here:
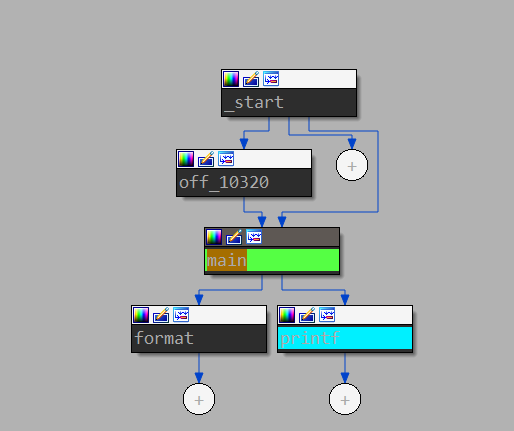
Flow graph of main function
Let's take a look at the main windows that IDA Pro initially displays for us.
Author's note. In my opinion, the representation in the form of a graph is more convenient, since it gives an idea of the structure of the function.
0x33 Touching Aunt Ida's pens
Finally, we opened the binary and saw how it looks from the inside. What to do with it and where to start the reverse? Where do you start touching our main reversed instrument, the IDA Pro? The first is masterly possession piano hot keys. Without knowing hotkeys, the life of a reverse engineer is boring, since keyboard shortcuts greatly help to diversify it and greatly increase the efficiency and speed of the reverse.
When you are just learning to work in IDA Pro, it is better to constantly keep in front of your eyes a plate (cheat sheet, cheatsheet) with hot keys. Below is an example of my cheat sheet. There is also an official cheat sheet from the IDA Pro developer company itself - Hexrays. The official cheat sheet can be found here , it has more button combinations, but in my opinion, for the first time, what is given on the cheat sheet below will be enough.
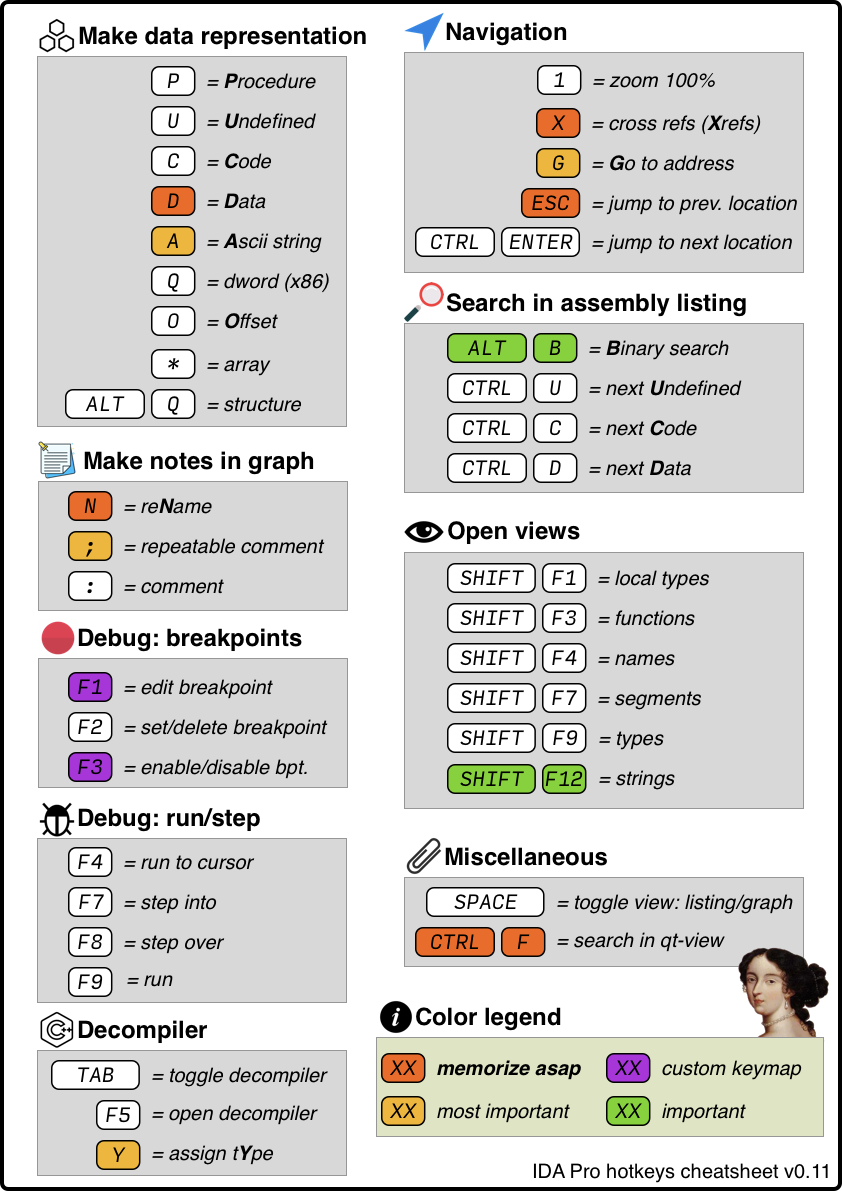
The attentive reader will notice that there are two important keyboard shortcuts missing from this table. The first is to save the database of the reverse results (CTRL + W, but there is no saving in the free version), the second is undo. So, forget about undo - it's not there. Real reverse engineers are too harsh to use the familiar CTRL + Z. Seriously though, the undo function was introduced only in version 7.3 (free - 7.0), and all because undo is not a very trivial task. The fact is that some change in the IDA database, made by the user, can lead to subsequent multiple avalanche changes. For example, the creation of a function (make code) leads to the recursive creation of all called functions.
After familiarizing yourself with the hotkey label, I recommend trying to press them for a while in IDA Pro itself. At the same time, you should not be afraid that you will break something or go “in the wrong place”, because this is exactly what will happen. Like any complex system, mastering IDA Pro to mastery in one evening is impossible.
Let's go through and at the same time try out various buttons in IDA Pro.
0x33a Graph and listing navigation
Navigation is one of the simplest and most understandable tasks, however, in order not to get lost in IDA Pro, you should practice the following:
0x33b Naming and margin notes
To change names (refactoring), you should try and work out the following actions:
0x33c data representation
Any part of the analyzed binary can be represented in the form of various options:
0x33d Difference of code from function
The presentation of the code can also be noted separately:
0x33e Presentation of instruction arguments
In addition to representing each byte in the form of various variants of the above, you can also represent the arguments of most instructions in different ways. For example, in the instruction for writing a number to a register, the mov eax, 0xFFFFFFFF second argument can be presented both in the current record and mov eax, -1. In order to change the presentation of an instruction argument, you need to right-click on it, and IDA Pro will show the possible presentation options.
0x33f IDA Pro Helper Windows
First of all, you should pay attention to Strings, Names, Functions, Hex Dump. All these windows can be opened by going from the menu bar View->Open Subviews.
0x40 There is so much in total and how to work with it?
; {EN}
; I think I found actual protocol parsing in function sub_401D3C
;
; But this function just chases bytes from corner to corner
; before actual parsing... we need to go deeper
; {EN}
0x41 What are we going to do?
Now that we know which buttons to press and have an approximate idea of how IDA Pro works under the hood, let's try to return to our task and find that part of the binary that is responsible for parsing the data exchange protocol of the experimental server.
If you look closely at the tab with the list of functions, you can see that IDA found only 76 functions in it, that is, it is a very small program. Real programs, let alone firmware, can consist of hundreds of thousands of functions. At the same time, the task is never posed to "blindly" restore the source code of the program to 100% (at least in my practice this has never happened). Among other things, the reverse is necessary:
0x42 Needle in a stack of bytes
; {RU}
; We are looking for a function for receiving data from the outside;
; We are looking for links to it;
; If not found, we try to search by logs (repeat items 1-3);
; {RU}
How do you find a needle in a haystack? In fact, the approaches are almost the same as when you get acquainted with a new API or an OpenSource project, and all the documentation in it is done in “doxygen”: we try to look for functions with sane names or we go from the operating system API.
Having doxygen documentation is great. It is understood that this is the only documentation, and during development programmers did not always bother to write comments to the function. That is, all there is is an HTML representation of the code with the names of functions and parameters (an extreme case).
Since it was originally said that this is a TCP / IP server, it is logical to assume that the data will “arrive” to the handler via recv, although in reality other functions can be used as well. For example, recvfrom, or API of a lower level - the OS itself (for Linux - read).
Note: anyone who wants to remember / get acquainted with working with sockets in C reads Socket programming in c using TCP / IP.
How do I do this in IDA Pro? First, we need a list of all names (strings and function names compiled into the program and imported from libraries). To do this, use the SHIFT + F4 keyboard shortcut. After clicking, the Names tab will open.
On the tab with the names, you can use the search, or rather the filter (in a broad sense, this is a more complex function with the ability to filter lines using a regex expression). In order to invoke the search, while in the tab with the names, press the key combination CTRL + F. After that, an input line will open at the bottom of the tab (as shown in the figure). In this line, you need to write a part of the word that we want to find (in our case, it will be recv), the list will be reduced, and only those lines will remain in which the specified keyword occurs (not shown in the figure).
The second column displays the address of the corresponding name. To go to this address in the listing, double-click on it (or ENTER).
Note: jump back in the listing is done with the ESC hotkey.

Names window for this binary
And so we get back to the listing. Now at the address of the recv function (remember that recv in this case is a library function, and its code is in the dynamic library).
The next step is to find the places in the program where the recv function is called. To do this, during analysis, IDA Pro creates cross-references between the function call instruction (or other function call) and the function itself. To see the places where the function is used, you need to move the mouse over the address (or name) to which we want to find cross-references and press the X button. Following this, a window will open, as in the picture below. The window will list all found cross-references. Moreover, the type column uses the following notation:
In our case, there are only two links:
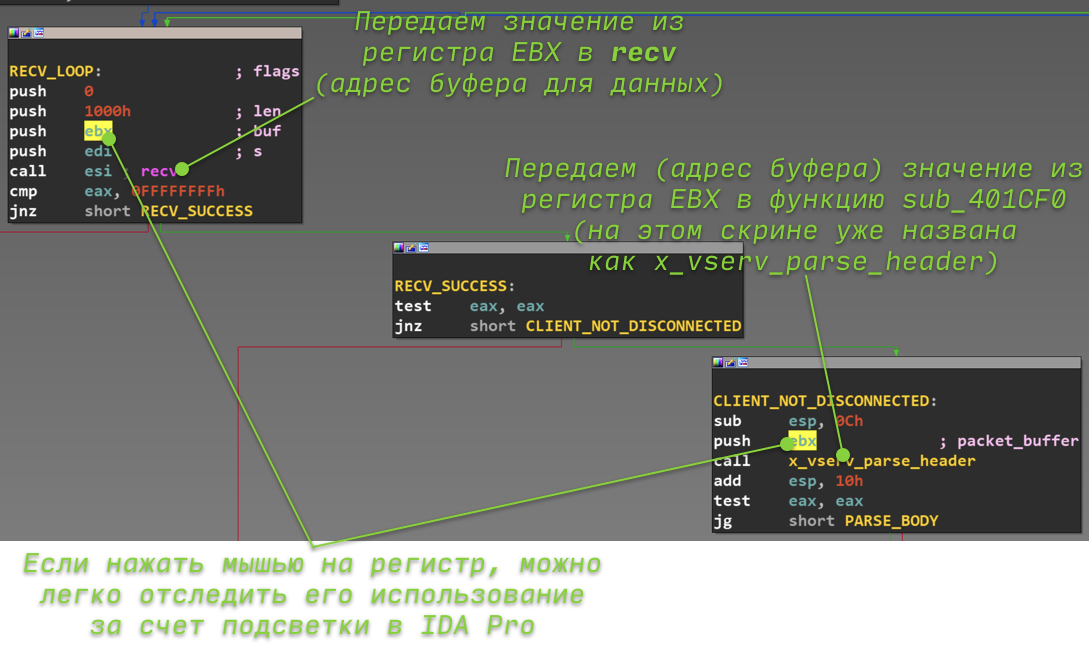
push 1000h ; len
push ebx ; buf
push edi ; s
call esi ; recv <---- Call recv here
As you can see from the assembler code, the call instruction jumps to the address from the esi register. During automatic parsing, IDA keeps track of what value was entered into the esi register and concludes that the recv address will always be in the esi register when the call is executed. This is why IDA creates a cross-reference to recv at this address.
 Cross-referencing to recv
We select a link with type p from the list, and IDA throws us into the graph (or listing), where the recv function is called. Above the screen is the IDA listing. We can see the function calling recv: sub_401D3C.
Simply? Yes. In this case. In reality, it may turn out that there are no direct links, and instead of recv, other functions are called, or the data is stored in some kind of buffer in the structure, and then processed in an unknown place (but the analysis of all this is a separate article).
0x43 Making "notes in the margins": sub_401D3C
; {EN} x_vserv_protocol {EN}
It is customary in our team to use the x_ prefix for naming functions (from the word eXecutable) to distinguish manually named functions from those automatically named by IDA Pro.
ax_ - prefix of named functions by scripts (IDAPython);
v_ - prefix of global variables (from the word Variable);
av_ - similar, but named by the script (IDAPython).
The sub_401D3C function, unlike recv, is part of this program. Therefore, you can investigate what is happening in this part of the "experimental".
Note : in general, the study of a program is often divided into two main methods: static and dynamic analysis. Static means that all analysis is performed only on the basis of the code (without starting the program), dynamics - taking into account the information obtained in the debug.
In our case, it would be easier to start the experimental debug (English "debug" - debugging) and after that start to study what is happening to him. But, firstly, in order to learn, we will conduct a purely static study: where-and-what is being done in processing immediately after receiving data from the socket. Secondly, before running something even on a virtual machine, I prefer to understand how it might end up
Well, as the theory of the experiment says, before performing the experiment itself, you need to understand how it can end, and what you will generally need to look at during the fireworks. So in our case, before starting the program, it is necessary to figure out in which variables to expect what data, and everything that is difficult to understand right away should be collected using information obtained from the dynamics.

Function call recv
Let's start taking “notes in the margins”. If you look at the function sub_401D3C, in which we find ourselves, you can see in it calls of two functions with unknown names: sub_401CF0 and sub_401BFD. In addition, we can see the call to the puts function - a standard library function from libc. It prints the string to stdout. Since the function prints something to the screen, then there must be lines from which you can get some information!
Note : in the previous section, we found the function of interest to us by the recv library function. However, the "gold mine" is strings. Just by looking through the lines in the Strings window ( SHIFT + F12 ) or looking for various keywords in it, you can extract a lot of additional information about the program's operation, or find places where something interesting is happening for us as reverse engineers. Never neglect the opportunity to look at the lines that are left in the program.
Even if you don't know much about assembler, you can easily figure out what exactly puts outputs here. In the block at 0x00401D64 (to go to this block, you need to press the g button and paste the specified address into the window) the line “Received failed” will be displayed, in the block at 0x00401D7A - “Client disconnected”, and in the 0x00401D9C block - “VSERV protocol error ... ”. Based on these lines, we can conclude that this server has an internal name VSERV (further, when naming functions, we will use such an identifier). In addition, you need to name the block labels by addresses:
Note: You should try to name everything during reverse engineering. If you come across a function and you have the slightest idea what the function does, rename it. In the future, when you stumble upon this same function, but under different circumstances, you will remember that you have already dealt with it, and it was important to you somewhere. You can also analyze its use for several use cases. Further in the text the phrase: “it is necessary to rename” will no longer be cited, it is assumed that this is a reflex.
Further you can see that the address 0x00401D54 is the beginning of a cycle in which the server is constantly “spinning” and receiving data from the client. This address can be called “RECV_LOOP”. The cycle in IDA Pro is easy to find using the graphical representation: the arrow for the transition from the bottom block (end of the cycle) to the top (start of the cycle) is highlighted in bold.
A good option for a function name at 0x00401D3C that we are in is, for example, x_vserv_protocol. It can be seen that it receives data from the client, after which two functions are called - in them there will be either a full parsing of the protocol, or pre-parsing (converting a data stream from TCP into "messages"). From the code that is in the x_vserv_protocol function, it is impossible to draw a full conclusion about what happens inside the sub_401CF0 and sub_401BFD functions, so let's go into each of them one by one and try to understand their functional purpose (you can go back with the ESC button).

Don't forget to rename labels and function names
0x44 Making "notes in the margins": sub_401CF0
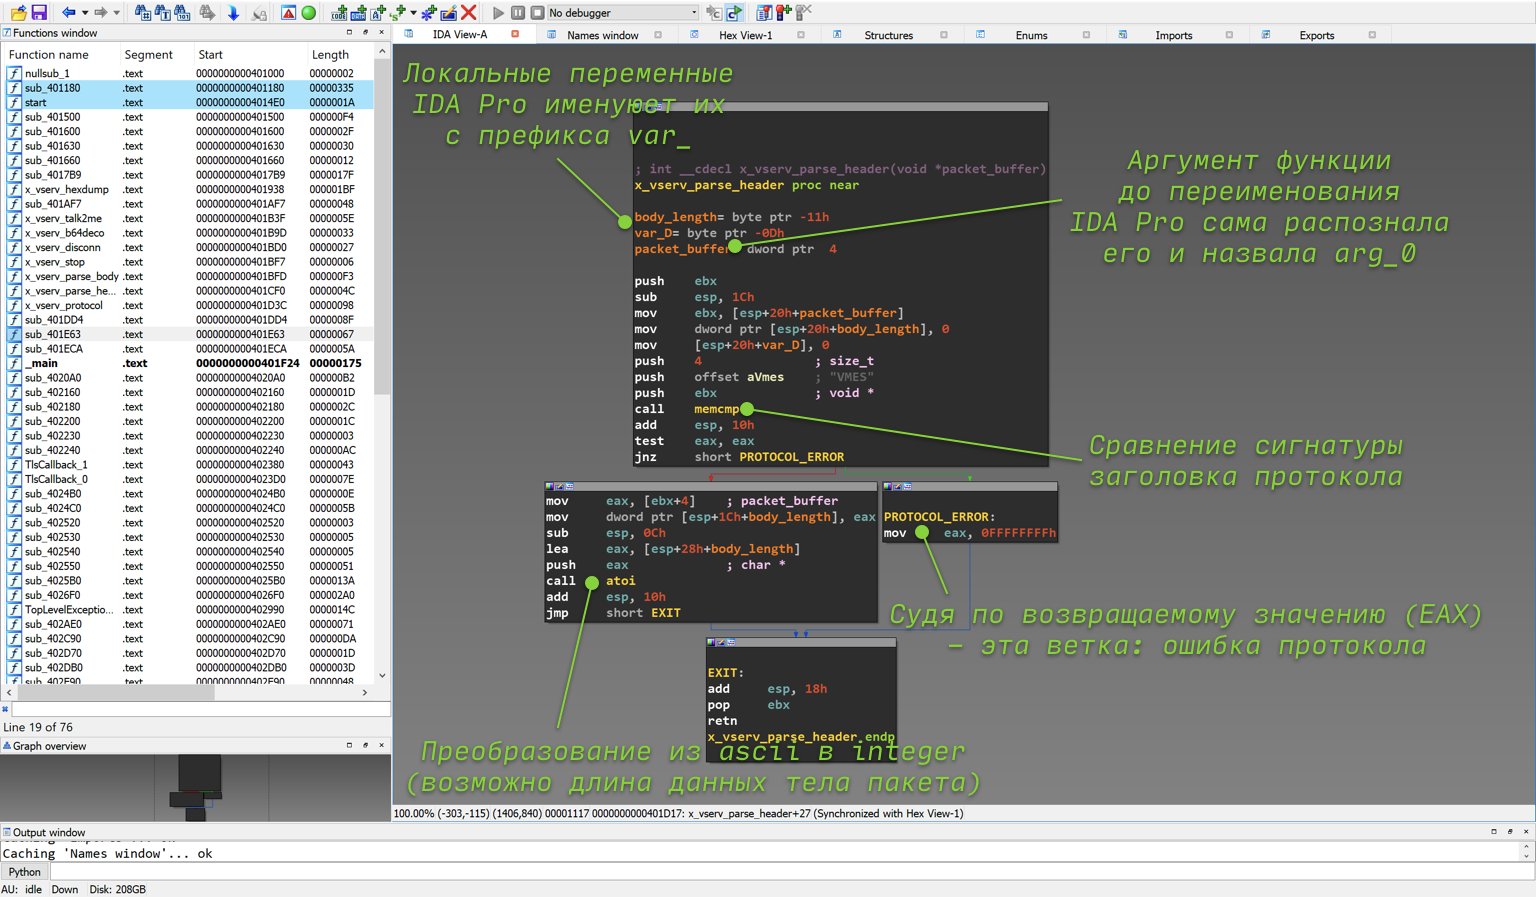
; {EN} x_vserv_parse_header {EN}
Let's start with sub_401CF0, since it comes first in the course of execution. To go to a function, you need to double-click on it with the mouse, as a result of which we find ourselves in a very small function sub_401CF0. The graph of its execution flow is shown in the figure below. Judging only by the general view of the graph (without going into the details of the assembler), we can immediately conclude that this function:
_Reverse function sub_401CF0 aka x_vserv_parse_header _
Let's figure it out in order, where it came from.
0x44a One argument and its purpose in the sub_401CF0 function
The IDA tries to recognize the arguments itself (for this, it, or rather its specific processor module, uses knowledge of the calling convention and other heuristic methods, but it can make mistakes). If the argument is passed through the stack, and not through the register (for x86, with the cdecl calling convention, which is most often used, this is exactly the case), then IDA Pro itself names such offsets in the stack with the arg_ prefix.
Note: The passing of arguments and the return of a value from a function during compilation is entirely determined by the calling convention. There are many nuances in the agreement, and there are quite a few variants of the agreements themselves (which one is used is also determined by the compiler). The main thing we need to know now is that x86 arguments are passed through the stack (using the push instruction), and the return value through the eax register (what is written in C after return).
Argument purpose. Why is the algorithm already named packet_buffer in the screenshot? You can figure this out by looking at the previous function, or rather, at what is passed to it as an argument. For clarification, below is another screenshot from the x_vserv_protocol function. The function receives a value from the ebx register as an argument. If you click on ebx with the mouse, IDA will highlight all its uses, due to which you can easily find the previous use of this value. It is also passed to the recv function (yes, the same one) as the second argument (remember that according to the calling convention on the stack, the arguments in the code are pushed in “reverse order”).
Function arguments x_vserv_parse_header _
The next step (for those who forgot the definition of the recv function) is to look at the recv documentation. From it it will become clear that the second argument is the address of the buffer into which recv will write the received data. I think it is now obvious that the only argument to the sub_401CF0 function is the address of the buffer with the data received from the TCP socket.
0x44b The sub_401CF0 function has no cycles and contains one branch
Let's remember how to quickly understand in IDA Pro whether there are loops in a function or not (an arrow from the bottom block to the top). Similarly, we look at the graph of the sub_401CF0 function and conclude that there are no cycles in sub_401CF0.
Probably everyone has already guessed that the two outgoing arrows from the block in the IDA Pro graph mean that this program block is part of the if-else in the source code. The color of the arrow means the following:
Note: usually the if-else construction after compilation turns into two instructions (at least):
0x44c The sub_401CF0 function calls two library memcmp and atoi
If we do not remember the definition and functionality of the library functions, we need to google them, as this information will allow us to understand what the analyzed code is doing. Sometimes the names of API functions may not be obvious at all, and even if you think that you know this or that function well, but there is a shadow of doubt, it is better to look at the documentation right away , in this case at memcmp.
Author's note: sometimes “fear… leads to suffering”, a long time ago, in one forgotten Galaxy, I reversed the device and, while in debug mode when loading Linux, I came across a call to the reboot function. At that moment, when the execution turned into a branch with this function, I stopped debugging and began to figure out what the problem was. Almost the entire working day was spent on all the disassembly. Finally, after looking at the reboot documentation, I read the following: "or enables / disables the reboot keystroke". Defeating "fear" and pressing F8 while on the reboot function, I realized that the device did not reboot, but continued to run ... RTFM!
It is quite easy to find that memcmp compares two arrays in memory and takes pointers of these arrays and the number of bytes to be compared as input. It seems that everything is simple and clear, but with the return value, not everything is so obvious, and newcomers to C often make a mistake. It is assumed that 0 - strings are unequal and 1 - strings are equal. In reality, if the strings are equal, the function will return 0, and if the strings are not equal, then either > 0 or < 0.
The second API function atoi converts an ascii string to an integer. Accordingly, a pointer to a string arrives at the input, and an integer value at the output.
0x44d Putting it all together and answering the two remaining questions
What conclusions can be drawn from the analysis of the use of these two API functions in the function under study?
First, memcmp checks the protocol signature (a unique sequence of bytes to "make sure" that the packet actually belongs to the given protocol). This conclusion can be made based on the fact that the buffer with the received data is passed directly to the memcmp function (try to track it yourself), the constant string “VMES” and the value 4 (obviously the length of VMES). After that, if the signature is not found, the program can turn to the branch where the value 0xFFFFFFFF (-1) is written to the eax register, or to the branch with atoi.
In this case, the memcmp function is used, not strcmp, although two strings are compared, due to the fact that you must specify the maximum signature length, 4 bytes. The strcmp function will compare until it encounters a null terminator. Although the signature "VMES" has a null terminator as the last, fifth character, in the incoming packet, the null terminator can be anywhere. Because of this, even if the package starts with this signature, strcmp will detect these lines as different.
Secondly, atoi most likely receives the length of the message body (although this does not directly follow from the analysis of only this part of the code). Take a close look and you will see that atoi takes a chunk of the buffer from the received data - four bytes after the VMES (this can be understood if you parse the assembler in the block at 0x00401D19) - and converts it to a number. The result of the atoi conversion is passed to eax. Thus, in eax at the exit from the function is either the value obtained from the received data, or -1. Also, remember that, according to the x86 calling convention, the return result of the function is in the eax register, the function checks for the signature in the first four bytes, if these bytes are not in the buffer, it returns -1, otherwise it converts the next four bytes to a number and returns it from the function. What better way to describe your code in natural language? That's right, write the code itself:
char tmp[5] = { 0 };
if (memcmp(&buf[0], "VMES", 4) != 0)
return -1;
*(int*) tmp = *(int*)(&buf[4]);
return atoi(tmp);
The code may seem strange at first. Questions may arise such as: where does the 5 byte buffer come from? Why is he here at all? Why can't you just pass to atoi (buf + 4) ? Let's start with the last question and for this we need the documentation for atoi, or rather the documentation for strtol (if you open the dock on atoi, then it refers to strtol indicating the number system 10). It says that the conversion takes place until a character is encountered that is not suitable for the given number system. That is, for the 10th system, this is any character not from the range from 0 to 9. During the reverse in such cases, it can be assumed that the author the program wanted to protect against the fact that a specially selected packet could be sent to the server, where this value will be indicated as large as you like. However, at the same time (as we will see later), he made other mistakes. As a result: copying to a separate buffer with a null terminator will avoid the problem of incorrect conversion of an ascii string.
The size of the buffer of 5 bytes can be determined by looking into the program stack (which will be discussed in more detail later in the article): in the list of function variables, the variable var_D goes right after buffer_length (therefore, they are located one after another on the stack). 0 is entered into it at the very beginning of the function, and this variable does not change in any way. Therefore var_D is the null terminator.
Based on the analysis, it is proposed to give the function a proud name x_vserv_parse_header (it has already been renamed in the screenshots).
0x45 Making "notes in the margins": sub_401BFD
; {EN} x_vserv_parse_body {EN}
0x45a A little about the stack and its frame
So, we have come to the last unparsed function in order to fully cover the "architecture" of that part of the program that is responsible for processing the protocol. As in the previous step of the reverse, you should start with her arguments. Let's turn to the block of the x_vserv_protocol function , which we previously named as PARSE_BODY (for this, as usual, you can press g , insert the block name there and press ENTER ). Before calling the function itself, two push instructions are visible, which obviously pass arguments to the sub_401BFD function we need (in the screenshots it has already been renamed to x_vserv_protocol_body ). To this end, take a look at the figure below.

What is body_buffer?
The first argument is the address (since the lea instruction is used) of a certain variable (named body_buffer in the screenshot). The second argument is what was received from the x_vserv_protocol_header function (since the eax register is passed to the push instruction unchanged). If everything is obvious with the second argument - the number after the atoi -transformation, then let's figure it out with the first one.
To understand what body_buffer is, you should pay attention to a couple of points:
char buffer[0x1000];
Note: why is this? To answer, you need to understand what a stack frame is, and how local variables, as well as arguments, are decomposed on the stack. For details on how the data is located in the stack, it is better to read one of the links at the beginning of the article, since the topic of the stack frame itself deserves a separate article. You can also read the article on Wikipedia.
Consider the structure of the stack (frame or frame) of the x_vserv_protocol function. To display the stack frame in IDA Pro, you need to double-click on one of the variables located in the stack (the screenshots show the “red” names at the very beginning of the function). After that, you will see a picture similar to the picture below.

Function stack frame
As it was written above, the pointer for receiving data through recv corresponds to the very beginning of the stack frame (since esp is used without offset). In this regard, you can name (as usual - with the N button) the top as vmes_sign (the signature “VMES” is expected in the first four bytes).
The next four bytes are the bytes that are passed to atoi in the x_vserv_parse_header function. The conclusion about a group of four bytes can be made from the first instruction of the left block of the x_vserv_parse_header function (address 0x00401D19). The mov instruction transfers exactly four bytes from [ebx + 4] to the eax register for subsequent conversion to atoi. Since we have decided that this is the length of the body of the package, we will name them as vmes_body_len.
Now it becomes clear that after the eight described bytes are the remaining data from the TCP packet. If you were developing a client-server application, then it is obvious that this remaining data is the body of the package, and its parsing (parsing) will most likely be in the function called after x_vserv_parse_header. Actually, this function in the screenshots almost immediately was named as x_vserv_parse_body.
0x45b Parse the packet body parsing function
Let's go back to the function itself (ESC button) and put everything together. The first argument for the sub_401BFD function (x_vserv_protocol_body - you can already rename it) is the packet body, data received from the TCP socket using recv, with the exception of the first eight (apparently, the first eight are the packet header). The second argument is data located at offset +4 from the beginning of the packet (presumably the length of the packet body) and "passed" through atoi to get a number from it.
Note : if someone with knowledge of Stack BOF (aka Stack Buffer Overflow, aka Stack Buffer Overflow) decided to read the article, he probably already smelled the blood of this very buffer overflow in the stack. A value is taken from the user data and converted to a number. If there is no further validation of this data, expect overflow troubles.
It's time to look into the x_vserv_protocol_body function itself , the graph of which is shown in the figure below.

X_vserv_protocol_body function graph
After long evenings and days of reverse engineering, a ladder-style function graph almost immediately suggests that the source code contained a chain of if-else-if-else-if-else (possibly also a switch ). Indeed, if you look closely at the function, you can clearly see that the first bytes of the packet body are taken in each of the blocks and are compared in turn with “HEXDUMP”, “TALK2ME”, “B64DECO”, “DISCONN”, “STOP !!!”. If none of this was found, then the line "Unknown command" is output to the console. Thus, it is clear that the lines listed above are protocol commands. If one of them is found, execution passes to the corresponding function. They can be named as follows: x_vserv_hexdump, x_vserv_talk2me, x_vserv_b64deco, x_vserv_disconn, x_vserv_stop. These are the protocol command handlers.
0x45c Let's probe some vserv command handlers
It is interesting to note that the number that is passed as the second argument is not used directly in this function anywhere, but is only passed on to the protocol command handlers. In addition, there is no validation of the amount of received data, that is, the program believes that it must have received a packet of at least 15 bytes (although this may not be the case at all). To still make sure that the second argument, aka len, is actually a number used as the size of the data, let's turn to one of the x_vserv_hexdump handlers. The piece of function we are interested in is shown in the figure below.
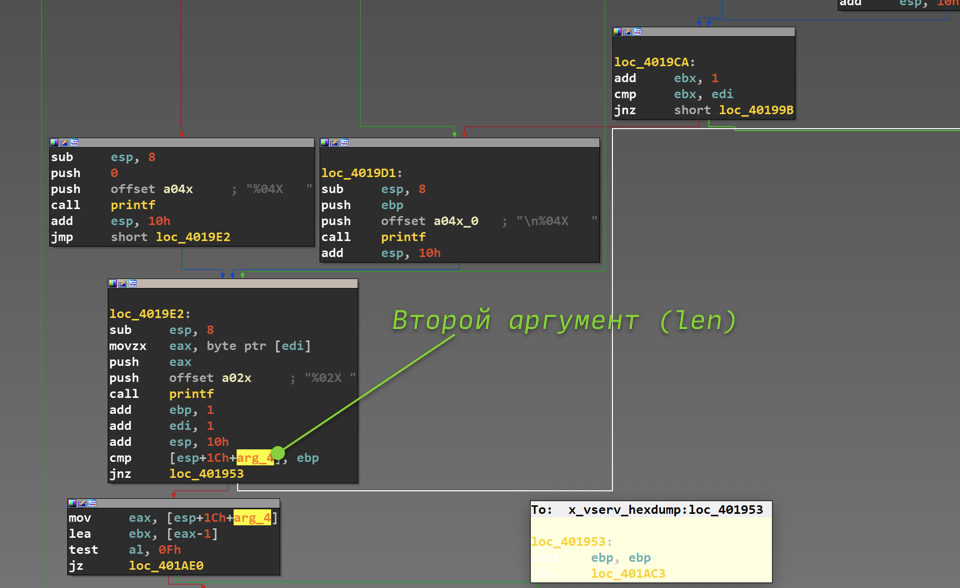
Second argument x_vserv_hexdump
From this code, you can see that the function has a certain counter stored in the ebp register (probably, the compiler did not have enough general-purpose registers, usually ebp is not used as a counter). It is compared with the second argument, and the loop ends when the counter value reaches the argument, that is, whatever value we specified in the package, this loop will be executed so many times.
0x45d Rounding off for today
0x50 Is this the end?
; {EN} x_vserv_parse_body {EN}
The article is aimed at setting out in as much detail as possible the basic reverse engineering technique, which would be understandable to a beginner and he could try to study other binaries. Of course, we did not touch on the analysis of algorithms, but in fact only looked at how to understand the structure of the program and where to go after opening it in IDA Pro.
If suddenly this article turns out to be not the 9th life of a reverse engineer cat, he will talk about the analysis of the VSERV protocol handlers in IDA Pro, help write a client for it and, together with the reader, look for the RCE vulnerability (it is there and lies on the surface) in this server.
Today we got acquainted with the basics of disassembly and IDA. In the next lessons we will try our hand at practice.
Binwalk - disassembling containers and firmware
Today we will talk about a very useful tool that makes life much easier when parsing the contents of files and containers - binwalk.
For those who like to “dig deeper” and really figure out how to open various firmware of routers, IoT devices, mobile phones and other mobile-portable equipment, we recommend that you familiarize yourself with Attify OS. In addition to Binwalk, which we'll talk about today, Attify contains a set of tools designed to help security researchers analyze and identify vulnerabilities in IoT firmware and embedded devices.
IoT devices and embedded systems use firmware, which often stores a lot of useful and often critical information for an information security analyst. These can be "hardcoded" credentials, triggers for obtaining debug and system information, undocumented features, backdoors, and much more.
We'll talk about Attify another time, but for now let's return to our rams, or rather, binwalk.
This tool is positioned as a tool for analyzing firmware and searching for various constants in them that will help determine what is inside the firmware, what packaging algorithms were used, what microprocessor architecture, and much more.
It works on the basis of a signature search specified through regular expressions (you can read the source code on the github of the project - https://github.com/ReFirmLabs/binwalk.
Often binwalk is used to roughly determine which files are in a certain container or just a binary file that is difficult to attribute to any known format. Binwalk will be able to detect the merging of two files into one by displaying the signatures of both file formats. Also, he will be able to unpack the found files (you need to add the -e switch). Describing all the functions is rather dreary and pointless, the main thing is that the main purpose is clear, and you can read about all the functions in “help” or on the github. So let's get down to practice and look at a couple of examples.
Practice
Let's try using binwalk on various files.
Executable file for Linux.
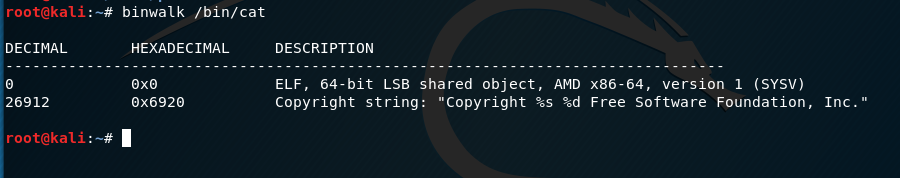
Nothing interesting, I found an ELF header and a copyright line.
Let's try to run binwalk on the router firmware. Let's take the firmware for Dlink Dir 300 (link to the firmware - tyk )
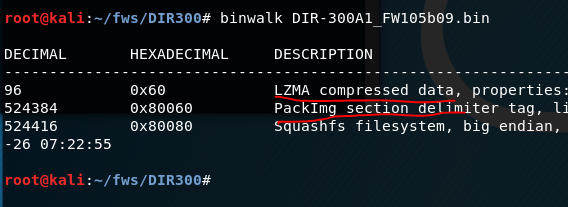
We see that a data compression algorithm has been discovered - quite typical for firmware. Let's try to unpack it using the “-e” switch.
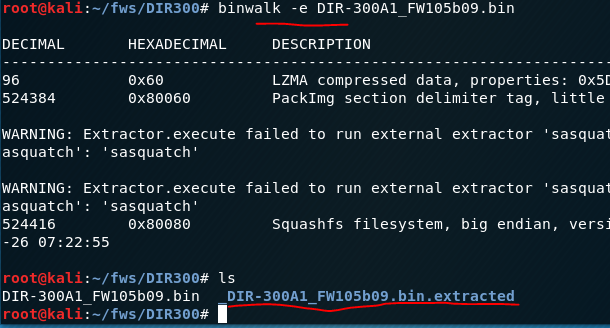
There were errors during unpacking, but the directory was created, which means that some data could be unpacked, let's see what we got.
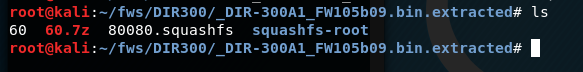
We see 2 files and a directory (it is empty), let's see what these files are.

One file is the executable module (essentially the kernel) and the other is the file system. Let's try to determine the microprocessor architecture for the first file that the code supposedly contains.
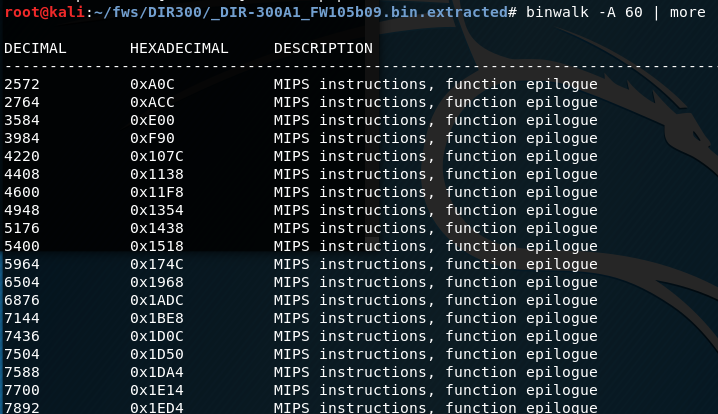
As expected, a significant number of occurrences were found. This means that this file contains the code and the logic of the firmware, that is, you need to investigate and look for vulnerabilities in it.
binwalk can also find other important and useful information for the explorer or reverser. It is quite easy to learn and very convenient for a number of tasks. It can also be fine-tuned thanks to the Python API, but that's a topic for another post.
Outcome
This tool is quite simple and useful for analyzing containers, firmware. It will not be superfluous in the arsenal of a reverse engineer, a specialist in computer forensics and a researcher of various embedded software.
For those who are seriously interested in the topic, once again we strongly recommend that you familiarize yourself with Attify OS.
In articles about "binary" we will touch upon the most basic functions of a PC, touch on the mystery of the concept of "reverse", we will understand a lot about the assembler and the central processor of the PC.
Let's start with the wikipedia definition.
Reverse engineering (reverse engineering, reverse engineering, reverse engineering; English reverse engineering) - the study of some finished device or program, as well as documentation for it in order to understand the principle of its operation; for example, to discover undocumented features (including software bookmarks), to modify or reproduce a device, program, or other object with similar functionality, but without direct copying.
This can be supplemented by the fact that reverse engineering also serves to find vulnerabilities in a software or device.
Reverse engineering with a simple example
You get a square box, on one side of the box there is a knob, by adjusting which, you set different values for the input, after fixing the knob, you can press the button and get the value on the other side of the box, which is considered an output. That is, in fact, you have a black box to which you can provide input data and receive output.
Now let's imagine that you were given only this box and there are no documents for it, that is, you don’t know how it works, you can simply supply values to the input and receive values at the output, you don’t understand how they are related, but you want to figure it out ... What for? Well, for example, in order to make the same box or to find an error in the box - the moment when it will produce the same results for different input data, although this should not be so, or something else. Your goals may be completely different, the only important thing is that you need to understand how it works or how its individual parts work.
To solve this problem, you can use different options, for example, you can analyze the relationship between input and output data and find the formula by which they change, but here you may face a problem: suddenly there are predefined constants inside the machine that you do not know about , and to confirm your formula, you will have to check all pairs of input and output data, and there can be a lot of them.
A good solution to this problem would be to parse the box and analyze its internal structure. To parse the box, tools are needed, and they may differ depending on the tasks, however, there are basic multitasking tools. For example, using a screwdriver, you can unscrew the frame of the box, fastening the internal elements, completely disassemble it and get the necessary elements out, however, we still will not get an idea of the work of the box if we just pull everything out of it. We need to analyze the relationship of all components when they work together, ideally, to understand through which elements of the box our input values pass, how they are converted and how they are processed at various stages, in general, to fully understand the algorithms for processing our values. The best option, of course, would be a step-by-step observation of the work of the box,
It is believed that reverse engineering is the most difficult part of information security, probably it is, because in order to really carry out full-fledged research, you need to know a lot of fundamental things, from building a processor to algorithms and their implementations, so this topic is considered very difficult , but it should be noted that it is paid accordingly.
Before we go directly to the study of our first program, we will recall the basics of computer science, the operation of the CPU, the OS device and executable files, we will recall the low-level programming languages (hereinafter PL) and much more. All this is necessary so that you have at least the slightest idea and understanding of what you will have to do when researching the application.
Let's start simple
Let's repeat what a CPU (central processing unit) is and what it is for.
So, the CPU serves to execute commands by the computer, it essentially executes a number of instructions laid down in it at the stage of production of instructions, modern processors can perform a huge number of operations at once.
All processor operations are very simple, for example, add two registers (variables) or send a value to the data bus, put a value in a register, take a value from the data bus and other simple operations. The following definitions, possibly unfamiliar to you, were mentioned: register, data bus, they will be explained later.
It should be remembered that in fact the processor perceives only sequences 0 and 1, that is, it works at a very low level and operates only with binary code.
Depending on the architecture, the command lengths can be different, can have a fixed length (the so-called RISC architecture), or have a non-fixed command length (for example, x86, x86-64). It is difficult for a person to perceive just numbers and consider them as commands; he needs a higher abstraction, which is precisely the assembly language.
Assembly language is different for different processor architectures. The assembly language is directly related to the binary codes of the processor instructions, that is, each assembly language instruction has a one-to-one direct correspondence with the processor opcode (an opcode is an operating code, which is quite often used to describe one processor instruction). Let's see an example. We have a command in assembly language for the x86-64 architecture:
mov eax, 1 - which means put the value 1 in the eax register
In hexadecimal notation of opcodes, this command will look like this:
B8 01 00 00 00
It can be seen that the assembler presentation is more convenient for humans and allows you to better understand what is happening in a given piece of code.
In the image below, on the left, you can see the hexadecimal representation of the opcodes, and on the right, the assembly language representation.
Output
- Reverse engineering - researching (for different purposes) a software or device
- The central processor executes instructions represented as 0 and 1 (binary)
- For the convenience of representing processor instructions, assembly language is used.
- However, an assembly language instruction corresponds to one processor instruction
- Assembly language is unique to each of the existing architectures
Processor, structure
The processor, in addition to the control unit and the ALU (arithmetic logic unit), also contains a memory device that includes registers - small cells of ultra-fast random access memory (RAM), which are used by the processor itself to perform any operations, depending on the architecture, the size of the cells , their number and common names are changing. There are also general registers and special registers. In fact, you can make a pretty big simplification and just think of registers as typeless, fixed-size variables that can be accessed instantly.
For a basic understanding of registers, I hope this information is enough, but I recommend that you familiarize yourself with this topic in more detail (links: https://en.wikipedia.org/wiki/Proce...en.wikipedia.org/wiki/Central_processing_unit).
Now we roughly understand how the processor works, and we may wonder how the processor distinguishes data from instructions, because in fact all information in a computer is numbers that can somehow be transferred to the processor as instructions. In fact, the OS solves this problem by adjusting the files through their format. The figure below provides a brief description of the PE format for Windows OC. For example, if you open two different pictures with the same extensions in a hexadecimal editor, you will see that the titles of these pictures will contain the same bytes, except of course the bytes associated with the extension. The OS understands by the file extension that this file is not executable, but the extension can be forcibly changed, for example, to * .exe (the extension of executable files in Windows), then the OS will think, that this is an executable file, but when you try to start it, an error will occur due to the fact that the file format is different, the OS will look for certain sections in the file, the necessary headers and will not find them, since we just changed the extension of the picture, and not the entire format file. This is how the commands that go to the processor are regulated.
Executable file format
Different operating systems have different executable file formats: for Windows it is the PE format, for Linux it is the ELF format, for OS X it is the Mach-O format. What does this mean in practice? If we have the same source code for a program on 3 different OSes, its compiled form will be different.
That is, a compiled program from the same source code on the same processor, but for different operating systems, will be different in each case. It is not possible to run a program compiled under Linux on Windows without using special tools. All this happens due to the fact that each operating system has its own executable file format. A format is a set of specific rules for constructing an executable file, for example, the header must contain a certain signature at such and such a position, then there is the size of the sections, then the sections themselves.
The file is built according to certain unified rules so that the OS, when starting the file, can correctly load it into RAM and transmit the correct instructions to the CPU that are in this file, and the OS will also provide the executable file with the necessary libraries, data, etc. The OS will understand all this from the content of the file, since it is built according to the rules of the executable file format for this OS. I also advise you to familiarize yourself with the formats of executable files, for example, the ELF format ( https://ru.wikipedia.org/wiki/Executable_and_Linkable_Format ).
Now let's move on to how to get the executable file. This process is called compilation, and you should already be familiar with it from a C ++ programming course.
Compilation
The process of converting source code on any high or medium level compiled language into machine code is called compilation. In essence, this is the transformation of our file with the source code, for example, in the C language, into an executable file under Windows, which you can run and see how it will execute the commands we specified in the source code. Compilation theory is very complex, in some universities, whole disciplines in several semesters are devoted to this, but we only need to know some fundamental points of compilation, but if you want to delve into this area, then keep in mind that you have to learn math very well.
What we are interested in for our purposes: Firstly, compilation is a unidirectional process that cannot be completely reliably reversed, that is, using the available machine instructions, we will not be able to get the code in C or C++, since the compilation process is a process with losses. Secondly, if you want to make any changes to the program and edit the source code, then to make these changes to the compiled program, you need to recompile it. Thirdly, the compiled program lacks such concepts as variables, functions, loops, etc., a compiled program is a set of machine instructions. Perhaps these are the main points that we need. A relatively complete compilation scheme is shown in the figure below.
The question may arise: "If it is impossible to get the source code from the compiled application, then how are we going to investigate it?" This question brings us to the process of converting a compiled application to a human-readable form. This process is called disassembly.
Disassembling
The process of converting (translating) machine codes into program text in assembly language is called disassembly. If you scroll through the lecture a little higher, you will notice that when we described machine codes, we took into account that one instruction in assembly language corresponds to each machine code, respectively, we can translate machine code into assembly code, which is more convenient to parse than sequences of zeros and units. This task is solved today by only a few tools: IDA Pro and radare2 (only for Linux). IDA Pro is the undoubted leader in this area, but it is paid, and the free versions have extremely reduced functionality, but we will still use it as the main research tool, because it has a wide range of functions, in addition to the main function - disassembly.
To understand how a program is executed, it is necessary to understand the architecture of modern computers. Modern computers are built according to the principles of von Neumann architecture:
1) The principle of homogeneity of memory.
This principle says that both program data and commands (program code) are stored in memory at the same time. There was another version of this principle in Harvard architecture. In it, data and instructions were stored separately from each other.
2) The principle of targeting.
Program memory can be thought of as a sequence of cells numbered with integers, and each cell can be read from memory or written to it by simply referring to it by its number.
3) The principle of programmed control.
Program execution is controlled by a series of instructions, these instructions are executed one after the other until a special instruction is executed, such as a conditional branch, an unconditional branch, or a function call.
4) The principle of binary coding.
All information (data and commands) is encoded in binary numbers.
Briefly about memory segmentation:
The RAM used in programs written in C / C++ is divided into two types of areas:
• Data segments
• Code segments (text segments)
The code segments contain the program code. Typically, these segments are write-protected, that is, the OS makes sure that the data in these segments is not changed.
Data segments contain program data (values of variables, arrays, etc.).
When the program starts, two data segments are highlighted:
• Global data segment
• Stack (for local variables)
Additional memory segments can be allocated and freed during the program operation.
Accessing an address outside the allocated segments (to segments that do not belong to your program) is a runtime error (access violation, segmentation fault).
Let's take a quick look at the issue of program execution
In the compiled code of your program, each function will have a separate section. The address of the beginning of this section is the address of the function, the address that will be substituted in the place where your function is called.
The body of the function corresponds to the sequence of processor instructions that was obtained after compilation. Working with data such as local or global variables occurs at the byte level, that is, there is no information about the types.
During execution, the address of each next instruction is stored in a special processor register IP (Instruction pointer), which points to the address of the next instruction. When instructions are executed, this register is incremented and thus instructions are executed sequentially. At the moment when any special instruction (conditional / unconditional jump, function call) is encountered, the IP changes and the execution of the jump to another instruction, which may be in another place in the program. For example, when calling a function, IP is translated to the address of the beginning of the function.
Consider the call stack
A call stack is a data segment used to store local variables, temporary values, return addresses, arguments passed to functions. The stack is allocated when the program starts and is usually small in size (about 4 MB).
The stack stores the local variables of the function that is currently being executed. When the function exits, the corresponding area of the stack, where the local variables of this function were located, is declared free, and another function can overwrite it.
Calling convention at a glance
Calling convention is a description of the technical features of calling subroutines, which defines:
- ways of passing parameters to subroutines;
- methods of calling (transfer of control) of subroutines;
- ways of transferring the results of calculations performed by subroutines to the call point;
- ways to return (transfer control) from subroutines to the call point.
A calling convention describes how to pass arguments to a function.
The options are:
- arguments are passed through processor registers;
- arguments are passed on the stack;
- mixed (accordingly, the algorithm is standardized, which determines what is transferred through registers and what is transferred through the stack or other memory):
- the first few arguments are passed through registers; the rest - via the stack (small arguments) or other memory (large arguments);
- small arguments are passed through the stack, large arguments are passed through other memory;
Argument order in registers and / or stack.
The options are:
- left-to-right or direct order: Arguments are placed in the same order in which they are listed when the function is called. Advantage: machine code corresponds to high-level language code;
- right-to-left or reverse order: arguments are passed in order from end to beginning. Advantage: it simplifies the implementation of functions that take an arbitrary number of arguments (for example, printf ()) (since the first argument is always at the top of the stack);
The code responsible for clearing the stack is:
- code calling a function, or calling a function. Advantage: the ability to pass an arbitrary number of arguments to the function;
- the code of the function itself or the function being called. Advantage: reducing the number of instructions required to call the function (the instruction for clearing the stack is written at the end of the function code and only once);
A way of passing a pointer to the current object (this or self) to a function in object-oriented languages.
Options (for x86 processor running in protected mode):
- as the first argument;
- via register ecx or rcx;
The code responsible for saving and restoring the contents of the registers before and after the function call:
- calling function;
- called function;
List of registers to be saved / restored before / after calling the function.
The calling convention can be described in the architecture ABI documentation, in the OS documentation, or in the compiler documentation.
Assembler Basics
Assembly language is a notation system used to represent, in human readable form, programs written in machine code. The assembly language allows the programmer to use alphabetic mnemonic opcodes, assign symbolic names to the computer and memory registers at his own discretion, and also set convenient addressing schemes (for example, index or indirect). In addition, it allows you to use different number systems (for example, decimal or hexadecimal) to represent numeric constants and makes it possible to mark program lines with labels with symbolic names so that they can be accessed (by name, not by address) from others. parts of the program (for example, to transfer control)
Command set:
The syntax of assembly language is determined by the instruction set of a particular processor.
Typical assembly language commands are (most examples are given for the Intel x86 architecture syntax):
• Commands for transferring data (mov, etc.)
• Arithmetic commands (add, sub, imul, etc.)
• Logical and bitwise operations (or, and, xor, shr, etc.)
• Commands to control the program execution (jmp, loop, ret, etc.)
• Commands for calling interrupts (sometimes referred to as control commands): int
• I / O commands to ports (in, out)
Some commands:
mov eax, 123; put value 123 into eax register
add eax, 321; add 321 to the value in the eax register
sub eax, 321; subtract the number 321 from the value in the eax register
jmp loc_deadbeef; unconditional jump to named label
push eax; put the value of the register eax on the stack
pop eax; get the value from the top of the stack and put it in the eax register
call strcmp; call the strcmp function
ret; return control to the calling function (the address is taken from the top of the stack)
Binary vulnerabilities
Under the binary vulnerabilities implied vulnerability contained in an executable (compiled) file. It is difficult to overestimate the severity of such vulnerabilities. For example, if such a vulnerability is found in a certain version of a popular software, then it applies to all copies of this product. You can view the differences from web application vulnerabilities. A vulnerability found in any particular web application will not be propagated to all others.
The list of typical binary vulnerabilities is presented below:
1) Buffer overflow (stack, heap)
2) Format string vulnerability
3) Integer overflow
4) Use after free
5) RCE
Buffer overflow.
Buffer overflows usually occur due to improper handling of data received from the outside and memory, in the absence of tight protection from the programming subsystem (compiler or interpreter) and the operating system. As a result of overflow, data located after the buffer (or before it) can be corrupted.
Buffer overflows are one of the most popular ways to hack computer systems, since most high-level languages use the stack frame technology - placing data on the process stack, mixing program data with control data (including the address of the start of the stack frame and the return address from the executed function) ...
A buffer overflow can cause a program to crash or hang, leading to a denial of service (DoS). Certain types of overflows, for example, a stack frame overflow, allow an attacker to download and execute arbitrary machine code on behalf of a program and with the rights of the account under which it is running.
A program that uses a vulnerability to destroy the protection of another program is called an exploit. The most dangerous are exploits designed to gain access to the superuser level or, in other words, to elevate privileges. The buffer overflow exploit accomplishes this by passing specially crafted input data to the program. Such data overflows the allocated buffer and changes the data that follows that buffer in memory.
Imagine a hypothetical system administration program that runs with superuser privileges for example, changing user passwords. If the program does not check the length of the new password entered, then any data, the length of which exceeds the size of the buffer allocated for storing it, will simply be written over what was after the buffer. An attacker can insert machine language instructions into this area of memory, for example, shellcode that performs any action with superuser privileges - adding and removing user accounts, changing passwords, changing or deleting files, etc. If execution in this area of memory allowed and in the future the program will transfer control to it, the system will execute the attacker's machine code located there.
Well-written programs should check the length of the input to make sure it is no larger than the allocated data buffer. However, programmers often forget this. If the buffer is located on the stack and the stack "grows down" (for example, in the x86 architecture), then using a buffer overflow, you can change the return address of the function being executed, since the return address is located after the buffer allocated by the function being executed. Thus, it is possible to execute an arbitrary section of machine code in the address space of the process. It is possible to use a buffer overflow to mangle the return address even if the stack is "growing up" (in this case, the return address is usually in front of the buffer).
Even experienced programmers can find it difficult to determine how much a buffer overflow can be a vulnerability. This requires in-depth knowledge of the computer architecture and the target program. It has been shown that even minor overflows such as writing a single byte out of the buffer can present vulnerabilities.
Buffer overflows are widespread in programs written in relatively low-level programming languages such as assembly language, C and C ++, which require the programmer to independently manage the size of the allocated memory. Troubleshooting buffer overruns is still a poorly automated process. Formal program verification systems are not very effective in modern programming languages.
Many programming languages, such as Perl, Python, Java, and Ada, manage memory allocation automatically, making buffer overflow errors unlikely or impossible. Perl provides automatic resizing of arrays to avoid buffer overflows. However, runtime systems and libraries for such languages can still be subject to buffer overflows due to possible internal errors in the implementation of these validation systems. Several software and hardware / software solutions are available on Windows that prevent code from executing outside of a buffer overflow if an overflow occurs. Among these solutions is DEP in Windows XP SP2.
In the Harvard architecture, executable code is kept separate from data, making such attacks nearly impossible.
EXAMPLE CODE.
The unsafe strcpy function is used, which allows writing more data than the array allocated for it can hold. If you run this program on Windows with an argument longer than 100 bytes, the program will most likely crash and the user will receive an error message.
The following program is not affected by this vulnerability:
Here strcpy is replaced by strncpy, in which the maximum number of characters copied is limited by the size of the buffer.
The diagrams below show how a vulnerable program can damage the stack structure.
An illustration of writing various data to a buffer allocated on the stack.
Before copying data.
The string "hello" has been pushed onto the stack.
The buffer overflowed resulting in an overwrite of the return address.
In the x86 architecture, the stack grows from large addresses to smaller ones, that is, new data is placed in front of those that are already on the stack.
By writing data to the buffer, you can write outside its boundaries and change the data located there, in particular, change the return address.
If the program has special privileges (for example, it is run as root), the attacker can replace the return address with the shellcode address, which will allow him to execute commands on the attacked system with elevated privileges.
Buffer overflow techniques vary with architecture, operating system, and memory area. For example, the heap buffer overflow (used for dynamic memory allocation) is significantly different from that of the call stack.
Stacking
Also known as Stack smashing. A tech-savvy user can use a stack buffer overflow to manipulate a program for their own purposes, in the following ways:
· Overwriting a local variable located in memory next to the buffer, changing the behavior of the program in their favor.
· Overwriting the return address in the stack frame. As soon as the function completes, control is transferred to the address indicated by the attacker, usually to the memory area that he had access to change.
· Overwriting a pointer to a function or an exception handler, which will subsequently gain control.
· Overwriting a parameter from another stack frame or non-local address that is pointed to in the current context.
If the address of the user data is unknown, but it is stored in a register, the "trampolining" method can be used: the return address can be overwritten with the opcode address, which will transfer control to the memory area with user data. If the address is stored in the R register, then a jump to the command transferring control to this address (for example, call R) will cause the execution of the user-specified code. The addresses of suitable opcodes or memory bytes can be found in the DLL or in the executable itself. However, addresses usually cannot contain null characters, and the locations of these opcodes vary depending on the application and operating system. The Metasploit Project, for example, kept a database of suitable opcodes for Windows systems (currently not available).
A stack buffer overflow should not be confused with a stack overflow.
It is also worth noting that such vulnerabilities are usually found using the fuzz testing technique.
Heap exploitation
A buffer overflow in the heap data area is called a heap overflow and is exploited in a different way than a stack buffer overflow. Heap memory is dynamically allocated by the application at runtime and usually contains program data. Exploitation is done by corrupting this data in special ways to force the application to overwrite internal structures such as pointers in linked lists. A common exploit technique for heap buffer overflows is to overwrite heap references (such as the malloc function metadata) and use the resulting modified pointer to overwrite the program function pointer.
The JPEG image processing vulnerability in Microsoft's GDI + is an example of a heap buffer overflow vulnerability.
This is theory. In the following lessons, we are going to practice.
Let's continue the topic of "binaries" and reverse. This is the second part of the tutorial.
Today we will have a little practice and fun (and not so much fun with everyone's favorite IDA disassembler, or in common people, Aunt Ida. In this article, we will look at the basics of disassembly and get acquainted with the interface of the most popular, although not the only program, that helps with this.
I want to note that we have already considered another disassembler, which in terms of functionality is comparable (and in some cases even superior) with IDA, this is Ghidra from NSA.
Before we start having fun with Ida, let's deal with the question “What is a disassembler?”.
Disassemblers and Debuggers
A disassembler is a program that allows you to convert machine code into assembly language code. This definition is rather simplified, but sufficient.
The disassembler market is not particularly full of various products. There are many different reasons for this, one of which is that there is no need for reverse engineering. If you try to break disassemblers into categories, then it would be more expedient to break them into 2 classes: interactive and non-interactive. Interactive disassemblers are those that allow you to interact with yourself to improve output and simplify analysis. Such disassemblers are radare2 and IDA PRO.
Non-interactive ones display the result of their work and do not allow you to conveniently interact with themselves to improve the output - ObjDump, and other old disassemblers.
What is a debugger?
A debugger (or debugger) is a computer program with which you can debug in programs (compiled, interpreted, with a virtual machine).
Debugging is the process of tracing, tracking, setting, and changing the values of variables during code execution. Also setting and removing so-called "breakpoints".
Tracing is the process of stepping through a program. In trace mode, the programmer sees the sequence of command execution and the values of variables at a given step in the program execution, which makes it easier to detect errors. Tracing can be started and ended anywhere in the program, program execution can stop at each command or at breakpoints, tracing can be performed with and without entry into procedures, and also performed in the reverse order (a step back).
Let's summarize
A debugger is a program that launches another program in itself and allows you to execute it step by step, while monitoring all the important values of the program during execution (variables, memory), while being able to change them and change the program flow.
What kind of debuggers are there?
List of well-known popular debuggers (some of them are no longer supported and outdated, for example SoftIce)
- AQtime is a commercial debugger for applications created for .NET Framework versions 1.0, 1.1, 2.0, 3.0, 3.5 (including ASP.NET applications), as well as for Windows 32- and 64-bit applications;
- DBX is a standard source-level debugger for C, C++, Fortran, and Java, available for Solaris, AIX, IRIX, Tru64 UNIX, GNU / Linux, and BSD operating systems;
- DDD is a graphical frontend for DBX and GDB debuggers using the Motif widget library;
- DTrace - dynamic tracing framework for Solaris, OpenSolaris, FreeBSD, Mac OS X and QNX; DTrace is not a debugger in the classical sense of this term, since DTrace cannot suspend the program, because of this DTrace cannot be used to step through the program;
- Electric Fence - memory debugger;
- GNU Debugger is a portable source-level debugger and disassembler from the GNU programming system that works with many programming languages, operating systems, and system architectures;
- LLDB is a source-level debugger for a variety of POSIX-compliant systems;
- IDA is a machine-level disassembler and debugger for the GNU / Linux and Windows operating systems;
- MDB is a generic modular source-level debugger for Solaris, can be used as a local kernel debugger;
- Microsoft Visual Studio - Microsoft Corporation's software development environment, including source-level debugging tools;
- OllyDbg is a free native-level debugger for Windows operating systems;
- Immunity Debugger - a debugger similar to OllyDbg, but with the ability to connect scripts in Python;
- SoftICE is a kernel-level debugger for Windows operating systems;
- Dr. Watson is a standard Windows debugger that allows you to create memory dumps;
- TotalView is a commercial debugger for Unix;
- WinDbg is a free debugger from Microsoft.
- FlexTracer is a commercial SQL query debugger for various DBMS.
Debugger types
Debuggers are different, this can be understood from the list above. They can be conditionally divided into the following categories:
- Source code debugger (or with the ability to access the source code)
- Debugger for executable files (i.e. fully compiled programs, it is also often called a custom debugger because it runs in a so-called user-space)
- OS kernel debugger (for debugging the operating system kernel, it is also often called the kernel debugger because it runs in kernel-space)
Debugger for reverse engineering
For reverse engineering purposes, the user-space and kernel-space debugger is most often used, since there is usually no access to the source code. If we consider debuggers for Linux, then this is gdb, with various extensions.
There are several solutions for Windows, for example Immunity Debbuger as user-spcae and WinDbg as a kernel debugger.
This is what Immunity Debugger looks like.
For reverse engineering and searching for vulnerabilities, the debugger plays a fairly large role. Using it, you can determine what a particular function is doing, how the stack or heap is overwritten, where this or that function is called, and much more.
IDA Pro
IDA PRO is considered to be the main disassembler. This tool has tremendous potential for the researcher. This disassembler supports a huge number of architectures, which makes it possible to successfully conduct research on various embedded software. Also, IDA PRO is a good help for the extension, as it has its own built-in scripting language - idc, as well as a convenient API in Python, which allows you to use the power of the scripting language. In this course, IDA PRO will be considered the main disassembler.
There is a rather subtle point related to IDA PRO. The point is that the full version has a pretty decent price tag. Free versions are rather narrowly functional, and only support 2 architectures x86, x86-64. However, most aspiring researchers who do not have a job and an official license for IDA use pirated versions. On the Internet, there are many different full versions of IDA PRO, from 6.6 to 7.0. Also, in licensed versions of IDA, you can often find a joint add-on - the HexRays decompiler. This decompiler simplifies the analysis of x86, x86-64 applications.
IDA Pro is a rather difficult tool to fully master, due to the large number of available functions and the ambiguity of some functions. However, basic work skills can be acquired after a few hours of work.
Having fun with Aunt ID
To download a file (a file means an executable file or, for example, some kind of firmware) into IDA Pro, you can use 2 methods. The first is that after starting IDA Pro, you can transfer the required file to the IDA window. The second way is to find the “File” tab in the IDA control panel, find the “Open” option in the drop-down menu, then find the required file and open it.
Uploading a file to IDA works differently depending on the file. If the file contains little code and data, then loading and automatic analysis will go almost imperceptibly. It should also be noted that for known formats of executable files, automatic analysis will be extremely successful, since IDA will be able to correctly parse all headers and unload all data correctly. What does it do? All functions and links will be successfully recognized and restored. That is, we can reliably say that this function uses the given string from the data segment.
However, sometimes you can find files protected by packers, various technologies and obfuscators. In this case, the result of the automatic IDA analysis would be rather useless. Without user assistance, packed files will not be recognized correctly.
After automatic analysis in the IDA Pro window, a graph of the order of procedure calls will be displayed (see the figure below); to switch to the mode of listing the assembler code, press “Space”.
One of the main conveniences and advantages of IDA is the graphical display of branches in the code of functions, which allows you to split the function into logical blocks and more conveniently observe the conditions for transition to a particular block of code.
Also, it is worth noting the display of information about the use of the stack by the investigated function. Before the first command of a function, you can most often notice an indication of the number of used local variables allocated on the stack and the number of arguments, as well as see the offsets at which local variables are on the stack.
Due to the multifunctionality of IDA, there are a large number of so-called "hot keys" that allow you to quickly perform certain actions. This list is quite extensive and it is only advisable to study it fully if you are going to do reverse engineering quite seriously. However, you still need to know some of these combinations.
" Space (space)" - transition from graphical representation to text and vice versa.
" Shitf + f12 " - displays a section of strings.
" A" - converting the data on which the cursor is located into a string (convenient for converting hexadecimal constants that are ASCII table codes into a character form)
" N" - rename (function, label, variable, etc.)
" Alt + t" - search by the text displayed in the current window.
"X" - search for cross-references to the selected object (selection is done by single-clicking the LMB on the object of interest, which can be a function, line, label, etc.), one of the most frequently used keys when analyzing the code. allows you to understand where the function was called, or where the string is used.
All of the given combinations can be found in the top menu of IDA, however, searching for them and clicking with the mouse will take a lot of time compared to pressing on the keyboard.
0x00 start
; {EN} entry point, do nothing, just run _main {EN}
An article for novice "warriors of darkness", those who want to plunge into the dark side of power: reverse engineering. On our "operating table" there will be a small artisanal server that runs on the TCP / IP protocol. To analyze the communication protocol, we will be helped by the de facto standard in the field of reverse - IDA Pro.
A lot of articles on reverse engineering and IDA Pro have already been written (although not as much as on PHP), but since the reverse process is an exploratory process, thoughts on how to approach the reverse engineering task from the “other side” are useful for beginners. At least as an author, I have been guided to outline the basic practices and techniques that I talk about in the early days to all trainees and in the first couples of a reverse engineering course at university.
Ahtung! As in the process of any sex with strangers, it is recommended to use protection here! Do not run binaries on the main system, it is better to do it on a virtual machine!
Subject: crackme .
Minimum system requirements: a virtual machine with Windows 7 / 0xA installed.
0x01 mov eax, ds: __ stack_chk_guard
; {EN} Disclaimer {EN}
Almost the entire article is written in the context of the assembly language and x86 processors, so working with memory, conditional jumps (flags), instructions, etc. will be described in the context of this particular processor core. Keep in mind that although other processor architectures exist, at the time of reading this article, we will be neglecting fundamental differences.
0x10 What do we need to understand what is going on?
; {EN} Setups prerequisites for the consequent execution {EN}
For the article to be interesting and understandable, it is assumed that the reader knows:
- programming language C or C++;
- x86 assembly language basics;
- the existence of executable file formats (PE, ELF);
- about the function stack frame, superficially enough;
- how to work with sockets;
- mathematical analysis;
- nuclear physics theory...
The second thing we need is a test subject. Any executable file will do (it is a binary, it is a file with the * .exe extension for Windows), but it is recommended to take the one attached to the article. If you take your own binary, it is better if it is a file compiled for x86 (for the first time, you should not take compiled for x64 - in them the assembler is more complicated).
Third - of course, at least basic knowledge of the assembler language x86.
In order to deliberately dig into the program and reverse it, it is highly desirable to know the x86 assembly language: instructions ( mov , lea , push / pop , call , jmp, arithmetic and conditional jumps), registers and processor principles. If they are not at all, then it is strongly recommended to study at the beginning, for example:
- in detail, in Russian: Assembler. Lessons from 2011 (don't mind that the design is from the 90s);
- briefly on assembler, in English: Guide to x86 Assembly;
- average of what the processor actually sees in English: A Guide To x86 Assembly.
Author's note. I want to note that when I myself was just starting to do this, the assembler looked like it continues to look like regexp (regular expressions) - like you know all the letters, but don't add up to words. However, I gradually began to understand what instructions do and what happens in the processor.
Fourth - 30 minutes of time (although maybe 30 hours) and a desire to learn.
0x20 A moment of philosophy or what is IDA Pro and why?
; {EN} Whatta hell? {EN}
What does a researcher need first of all? A notebook and pen to guide and organize the knowledge gained. So, what does IDA have to do with it? IDA is an acronym that stands for Interactive Disassembler. The key and revolutionary in its time was precisely “interactive”. This means that as a result of your work, you get not just a long assembly listing, but something where you can leave your notes, that is, as if this is a valid listing, but in which you can make "notes in the margins", and they change according to throughout the listing. You can also compare it with the refactoring function in modern programming IDEs - the function was renamed in one place, it was renamed everywhere, the variable - in the same way, etc. Your task as a researcher is to leave only important information from a huge array of difficultly analyzed information and give it a form that is well understandable for a person. It is the interactivity of IDA Pro that allows you to do this very effectively, and today no one surpasses it in this.Reverse engineering (or reverse engineering) is “the process of extracting knowledge from what has ever been done by a person ... In fact, a reverse engineer is a researcher (scientist), with the only difference that he understands what is not received. naturally, but created by someone” - Reversing: Secrets of Reverse Engineering, Eldad Eilam.
It is worth noting, however, that given the ever-growing closed code base and monkey-printed code on the internetThe software is getting harder and harder to reverse manually and interactively. Because of this, code analysis tools aimed at automated processing are now actively developing - radare2 (no matter what r2 adherents say, the interactive Cutter interface is not as interactive as in IDA Pro). Moreover, IDA Pro is also very well automated with its built-in Python interpreter and API.
And yet, no matter how cool the automated analysis is, it is not automatic, that is, it cannot replace the researcher by 100%, and sooner or later the researcher needs to engage in battle. Therefore, when all the preparations are finally completed, let's start learning IDA Pro! Let's begin to gradually disassemble our experimental sample.
0x30 Looking at IDA Pro and learning the basics of its interface
; {EN}
; This function is too complex.
; Perhaps it interacts with user.
; But currently I am not sure about it.
; A lot of calls to Qt-framework.
; {EN}
0x31 Loading the binary into IDA Pro
Open IDA Pro. Before us, after all the starting windows (which can be closed immediately), the initial program window appears. All you need to do is drag and drop the binary under investigation into it. After that, in the window that appears, click the "OK" button.
IDA Pro main window when loading a binary
In our case (if you loaded the same exe-file into IDA, which is attached to the article) you do not need to make any settings, IDA Pro itself recognizes the format of this file (PE, portable execute), but if you drop the firmware or dump from the microcircuit there memory from, for example, a router, everything will be much more complicated.
There is no single standard for storing firmware. Each manufacturer chooses the format of the update file for himself, which gives some protection against reverse engineering, since in order to get to the code, you first have to parse this format.
After being extracted from the update file, the code itself can be located at any address in the device's memory. Finding a code base point is a separate task that deserves its own article.
As for the memory dump, the microcircuit itself may already have a file system taking into account “scrambling” (mixing blocks in flash memory in order to reduce wear and tear). Putting these blocks back together is often not the most trivial task. To restore the scrambling scheme, you need to reverse the scrambler itself.
This is what the scrambler execution flow graph looks like.
0x32 What did IDA Pro show us?
After loading the binary, IDA Pro performs its preliminary automatic analysis: it determines functions, global variables, strings - everything that can be automatically pulled out of the analyzed file. The analysis is performed by the IDA Pro processor module (not to be confused with the processor itself). In fact, this is a plugin for IDA Pro (if you wish, you can write your own in Python or C ++). In our case, IDA uses the so-called Meta PC - an x86 / x64 variant that takes into account most of the tweaks that have been added to the architecture from Intel and AMD. Automatic analysis is performed again based on the fact that there is a complete description of the file format that we uploaded to IDA, in our case the same Portable Executable. This format clearly indicates which sections are in the file, which section contains the code, where is its entry point, and in which section the data (constants or global variables). As usual, such a trick does not work with firmware, and you need to manually mark the input file (or write a loader plugin for IDA, which will be able to "crush" pieces of the firmware binary as needed, after which the IDA processor module will be able to start analyzing).
Automatic analysis under the hood is extremely complex, but for each instruction it is as follows:
- decoding an instruction from a binary representation to an internal one (analyze);
- binding instructions taking into account the specifics of its execution (emulate - not to be confused with emulation, as, for example, in QEMU);
- converting instructions and arguments to mnemonics.
It should be noted that this is a very general description of what actually happens. It is presented in order to give a basic understanding of what automatic analysis performed in IDA is.
A few words about how IDA Pro stores the reverse result. After or during automatic analysis, the “project” can be saved (if, of course, you have the full version). IDA stores the result of the analysis in the form of a special database with its own structure (no, this is not the fancy MongoDB) on the hard disk. It is a single file with the extension .idb (or .i64).
After the automatic analysis is complete, you will see a window similar to the one in the figure below. The main elements that a novice researcher should pay attention to are labeled on the screenshot itself. The completion of the automatic analysis can be determined by the AU: Idle inscription in the lower left corner of the IDA Pro.
The GUI of IDA Pro is written in Qt, so if you have ever worked with applications written in Qt, the same rules apply here:
- total drag & drop of windows;
- everything opens in different tabs, which can be rearranged as you like. Sometimes you can accidentally close them and then look for a long time for the menu where this tab opens.
Flow graph of main function
Let's take a look at the main windows that IDA Pro initially displays for us.
- An execution flow graph is the main form of a disassembler (one might say, a flowchart representation of a function's algorithm). It displays processor instructions received after disassembling from a binary form. Only one function is shown in this graph. Each function can be divided into blocks according to the instructions of a conditional or unconditional jump (go to the right - one block, to the left - another block). In addition to this type, there is another one, where the result of disassembly is displayed as a continuous listing.
Author's note. In my opinion, the representation in the form of a graph is more convenient, since it gives an idea of the structure of the function.
- List of functions - a window in which functions that were found in the binary are displayed. These are the same functions that were written by the programmer when creating the program (excluding optimization). If the developer did not remove debug information during compilation (in gcc this is the -s option ) or even compiled the program with the -g option, then we will see all the function names in exactly the same form as the programmer. Otherwise IDA Pro will display them as sub_ <virtual_address_function>;
- List of Strings - not shown, but can be built by pressing SHIFT + F12. One of the most important menus in IDA Pro - it shows all the lines that are in the program. Using strings, in some cases, we can find all the functionality we are interested in.
0x33 Touching Aunt Ida's pens
Finally, we opened the binary and saw how it looks from the inside. What to do with it and where to start the reverse? Where do you start touching our main reversed instrument, the IDA Pro? The first is masterly possession piano hot keys. Without knowing hotkeys, the life of a reverse engineer is boring, since keyboard shortcuts greatly help to diversify it and greatly increase the efficiency and speed of the reverse.
When you are just learning to work in IDA Pro, it is better to constantly keep in front of your eyes a plate (cheat sheet, cheatsheet) with hot keys. Below is an example of my cheat sheet. There is also an official cheat sheet from the IDA Pro developer company itself - Hexrays. The official cheat sheet can be found here , it has more button combinations, but in my opinion, for the first time, what is given on the cheat sheet below will be enough.
The attentive reader will notice that there are two important keyboard shortcuts missing from this table. The first is to save the database of the reverse results (CTRL + W, but there is no saving in the free version), the second is undo. So, forget about undo - it's not there. Real reverse engineers are too harsh to use the familiar CTRL + Z. Seriously though, the undo function was introduced only in version 7.3 (free - 7.0), and all because undo is not a very trivial task. The fact is that some change in the IDA database, made by the user, can lead to subsequent multiple avalanche changes. For example, the creation of a function (make code) leads to the recursive creation of all called functions.
After familiarizing yourself with the hotkey label, I recommend trying to press them for a while in IDA Pro itself. At the same time, you should not be afraid that you will break something or go “in the wrong place”, because this is exactly what will happen. Like any complex system, mastering IDA Pro to mastery in one evening is impossible.
Let's go through and at the same time try out various buttons in IDA Pro.
0x33a Graph and listing navigation
Navigation is one of the simplest and most understandable tasks, however, in order not to get lost in IDA Pro, you should practice the following:
- moving around the function graph with the mouse;
- go to various functions with a double click of the mouse, go back with ESC and again forward with CTRL + ENTER (not in the cheat sheet - for advanced);
- switching between the graph and listing - SPACE, if suddenly you have switched on a different view (listing);
- cross reference: put the mouse pointer over any name (function or variable), and click the X. After that, you will see a window with other instructions that refer to this name (or a pointer in program memory);
- direct transition to a name or address (g): in the window that opens, write any of the existing names or an address (without 0x) from the current IDA Pro database - you will go to that part of the graph (listing) where this name is defined.
0x33b Naming and margin notes
To change names (refactoring), you should try and work out the following actions:
- Renaming names (to do this, click on the name and then N ): functions, variables (local and global), registers and labels. Try to figure out what can and cannot be renamed.
- Posting comments to instructions. In general, everything is simple: we selected the line to which we want to add a comment and clicked;.
0x33c data representation
Any part of the analyzed binary can be represented in the form of various options:
- byte (byte );
- word (word );
- double word ( dword );
- pointer (offset );
- indeterminate (undefined );
- disassembled code (code ).
0x33d Difference of code from function
The presentation of the code can also be noted separately:
- Code without a function (in this case, IDA Pro will not be able to build a graph);
- Function (to create a function from the code, you must press P).
For most of the code, during automatic analysis, IDA Pro itself recognizes where functions need to be created. How? Due to the fact that if at the time of disassembling instruction found call ( call ), the analyzer can definitely assert that the address held by the instruction in the argument - the start address of the function.
0x33e Presentation of instruction arguments
In addition to representing each byte in the form of various variants of the above, you can also represent the arguments of most instructions in different ways. For example, in the instruction for writing a number to a register, the mov eax, 0xFFFFFFFF second argument can be presented both in the current record and mov eax, -1. In order to change the presentation of an instruction argument, you need to right-click on it, and IDA Pro will show the possible presentation options.
0x33f IDA Pro Helper Windows
First of all, you should pay attention to Strings, Names, Functions, Hex Dump. All these windows can be opened by going from the menu bar View->Open Subviews.
0x40 There is so much in total and how to work with it?
; {EN}
; I think I found actual protocol parsing in function sub_401D3C
;
; But this function just chases bytes from corner to corner
; before actual parsing... we need to go deeper
; {EN}
0x41 What are we going to do?
Now that we know which buttons to press and have an approximate idea of how IDA Pro works under the hood, let's try to return to our task and find that part of the binary that is responsible for parsing the data exchange protocol of the experimental server.
If you look closely at the tab with the list of functions, you can see that IDA found only 76 functions in it, that is, it is a very small program. Real programs, let alone firmware, can consist of hundreds of thousands of functions. At the same time, the task is never posed to "blindly" restore the source code of the program to 100% (at least in my practice this has never happened). Among other things, the reverse is necessary:
- Find errors in the log. To do this, the program must look for places associated with receiving data from the outside;
- Parse a certain communication protocol in order, for example, to create your own API;
- Fix a bug in someone else's unsupported software library (seriously, I had to do this a couple of times);
- Something else…
0x42 Needle in a stack of bytes
; {RU}
; We are looking for a function for receiving data from the outside;
; We are looking for links to it;
; If not found, we try to search by logs (repeat items 1-3);
; {RU}
How do you find a needle in a haystack? In fact, the approaches are almost the same as when you get acquainted with a new API or an OpenSource project, and all the documentation in it is done in “doxygen”: we try to look for functions with sane names or we go from the operating system API.
Having doxygen documentation is great. It is understood that this is the only documentation, and during development programmers did not always bother to write comments to the function. That is, all there is is an HTML representation of the code with the names of functions and parameters (an extreme case).
Since it was originally said that this is a TCP / IP server, it is logical to assume that the data will “arrive” to the handler via recv, although in reality other functions can be used as well. For example, recvfrom, or API of a lower level - the OS itself (for Linux - read).
Note: anyone who wants to remember / get acquainted with working with sockets in C reads Socket programming in c using TCP / IP.
How do I do this in IDA Pro? First, we need a list of all names (strings and function names compiled into the program and imported from libraries). To do this, use the SHIFT + F4 keyboard shortcut. After clicking, the Names tab will open.
On the tab with the names, you can use the search, or rather the filter (in a broad sense, this is a more complex function with the ability to filter lines using a regex expression). In order to invoke the search, while in the tab with the names, press the key combination CTRL + F. After that, an input line will open at the bottom of the tab (as shown in the figure). In this line, you need to write a part of the word that we want to find (in our case, it will be recv), the list will be reduced, and only those lines will remain in which the specified keyword occurs (not shown in the figure).
The second column displays the address of the corresponding name. To go to this address in the listing, double-click on it (or ENTER).
Note: jump back in the listing is done with the ESC hotkey.
Names window for this binary
And so we get back to the listing. Now at the address of the recv function (remember that recv in this case is a library function, and its code is in the dynamic library).
The next step is to find the places in the program where the recv function is called. To do this, during analysis, IDA Pro creates cross-references between the function call instruction (or other function call) and the function itself. To see the places where the function is used, you need to move the mouse over the address (or name) to which we want to find cross-references and press the X button. Following this, a window will open, as in the picture below. The window will list all found cross-references. Moreover, the type column uses the following notation:
- p [rocedure] - cross-reference "by call", that is, the address (name) is used in the call statement;
- r [ead] - cross-reference for reading; at this point in the program reads from the given address (name);
- w [rite] - cross-reference to the record; at this point in the program, an entry is made to this address (name).
In our case, there are only two links:
- Reading the address of the recv function into a register (type r ),
- Calling recv directly (type p).
You may notice that there is no real direct cross-reference to recv in the invocation instruction. The call listing looks like this:
push 1000h ; len
push ebx ; buf
push edi ; s
call esi ; recv <---- Call recv here
As you can see from the assembler code, the call instruction jumps to the address from the esi register. During automatic parsing, IDA keeps track of what value was entered into the esi register and concludes that the recv address will always be in the esi register when the call is executed. This is why IDA creates a cross-reference to recv at this address.
We select a link with type p from the list, and IDA throws us into the graph (or listing), where the recv function is called. Above the screen is the IDA listing. We can see the function calling recv: sub_401D3C.
Simply? Yes. In this case. In reality, it may turn out that there are no direct links, and instead of recv, other functions are called, or the data is stored in some kind of buffer in the structure, and then processed in an unknown place (but the analysis of all this is a separate article).
0x43 Making "notes in the margins": sub_401D3C
; {EN} x_vserv_protocol {EN}
It is customary in our team to use the x_ prefix for naming functions (from the word eXecutable) to distinguish manually named functions from those automatically named by IDA Pro.
ax_ - prefix of named functions by scripts (IDAPython);
v_ - prefix of global variables (from the word Variable);
av_ - similar, but named by the script (IDAPython).
The sub_401D3C function, unlike recv, is part of this program. Therefore, you can investigate what is happening in this part of the "experimental".
Note : in general, the study of a program is often divided into two main methods: static and dynamic analysis. Static means that all analysis is performed only on the basis of the code (without starting the program), dynamics - taking into account the information obtained in the debug.
In our case, it would be easier to start the experimental debug (English "debug" - debugging) and after that start to study what is happening to him. But, firstly, in order to learn, we will conduct a purely static study: where-and-what is being done in processing immediately after receiving data from the socket. Secondly, before running something even on a virtual machine, I prefer to understand how it might end up
Well, as the theory of the experiment says, before performing the experiment itself, you need to understand how it can end, and what you will generally need to look at during the fireworks. So in our case, before starting the program, it is necessary to figure out in which variables to expect what data, and everything that is difficult to understand right away should be collected using information obtained from the dynamics.
Function call recv
Let's start taking “notes in the margins”. If you look at the function sub_401D3C, in which we find ourselves, you can see in it calls of two functions with unknown names: sub_401CF0 and sub_401BFD. In addition, we can see the call to the puts function - a standard library function from libc. It prints the string to stdout. Since the function prints something to the screen, then there must be lines from which you can get some information!
Note : in the previous section, we found the function of interest to us by the recv library function. However, the "gold mine" is strings. Just by looking through the lines in the Strings window ( SHIFT + F12 ) or looking for various keywords in it, you can extract a lot of additional information about the program's operation, or find places where something interesting is happening for us as reverse engineers. Never neglect the opportunity to look at the lines that are left in the program.
Even if you don't know much about assembler, you can easily figure out what exactly puts outputs here. In the block at 0x00401D64 (to go to this block, you need to press the g button and paste the specified address into the window) the line “Received failed” will be displayed, in the block at 0x00401D7A - “Client disconnected”, and in the 0x00401D9C block - “VSERV protocol error ... ”. Based on these lines, we can conclude that this server has an internal name VSERV (further, when naming functions, we will use such an identifier). In addition, you need to name the block labels by addresses:
- 0x00401D76 as RECV_SUCCESS;
- 0x00401D8C as CLIENT_NOT_DISCONNECTED.
Note: You should try to name everything during reverse engineering. If you come across a function and you have the slightest idea what the function does, rename it. In the future, when you stumble upon this same function, but under different circumstances, you will remember that you have already dealt with it, and it was important to you somewhere. You can also analyze its use for several use cases. Further in the text the phrase: “it is necessary to rename” will no longer be cited, it is assumed that this is a reflex.
Further you can see that the address 0x00401D54 is the beginning of a cycle in which the server is constantly “spinning” and receiving data from the client. This address can be called “RECV_LOOP”. The cycle in IDA Pro is easy to find using the graphical representation: the arrow for the transition from the bottom block (end of the cycle) to the top (start of the cycle) is highlighted in bold.
A good option for a function name at 0x00401D3C that we are in is, for example, x_vserv_protocol. It can be seen that it receives data from the client, after which two functions are called - in them there will be either a full parsing of the protocol, or pre-parsing (converting a data stream from TCP into "messages"). From the code that is in the x_vserv_protocol function, it is impossible to draw a full conclusion about what happens inside the sub_401CF0 and sub_401BFD functions, so let's go into each of them one by one and try to understand their functional purpose (you can go back with the ESC button).
Don't forget to rename labels and function names
0x44 Making "notes in the margins": sub_401CF0
; {EN} x_vserv_parse_header {EN}
Let's start with sub_401CF0, since it comes first in the course of execution. To go to a function, you need to double-click on it with the mouse, as a result of which we find ourselves in a very small function sub_401CF0. The graph of its execution flow is shown in the figure below. Judging only by the general view of the graph (without going into the details of the assembler), we can immediately conclude that this function:
- It receives only one argument as input (and, most likely, using the recv function, data from a TCP socket);
- It has no loops and contains one branch (if-else);
- Calls two library functions memcmp and atoi ;
- One of the branches returns 0xFFFFFFFF (-1) as a result;
- Checks the signature in the incoming data.
_Reverse function sub_401CF0 aka x_vserv_parse_header _
Let's figure it out in order, where it came from.
0x44a One argument and its purpose in the sub_401CF0 function
The IDA tries to recognize the arguments itself (for this, it, or rather its specific processor module, uses knowledge of the calling convention and other heuristic methods, but it can make mistakes). If the argument is passed through the stack, and not through the register (for x86, with the cdecl calling convention, which is most often used, this is exactly the case), then IDA Pro itself names such offsets in the stack with the arg_ prefix.
Note: The passing of arguments and the return of a value from a function during compilation is entirely determined by the calling convention. There are many nuances in the agreement, and there are quite a few variants of the agreements themselves (which one is used is also determined by the compiler). The main thing we need to know now is that x86 arguments are passed through the stack (using the push instruction), and the return value through the eax register (what is written in C after return).
Argument purpose. Why is the algorithm already named packet_buffer in the screenshot? You can figure this out by looking at the previous function, or rather, at what is passed to it as an argument. For clarification, below is another screenshot from the x_vserv_protocol function. The function receives a value from the ebx register as an argument. If you click on ebx with the mouse, IDA will highlight all its uses, due to which you can easily find the previous use of this value. It is also passed to the recv function (yes, the same one) as the second argument (remember that according to the calling convention on the stack, the arguments in the code are pushed in “reverse order”).
Function arguments x_vserv_parse_header _
The next step (for those who forgot the definition of the recv function) is to look at the recv documentation. From it it will become clear that the second argument is the address of the buffer into which recv will write the received data. I think it is now obvious that the only argument to the sub_401CF0 function is the address of the buffer with the data received from the TCP socket.
0x44b The sub_401CF0 function has no cycles and contains one branch
Let's remember how to quickly understand in IDA Pro whether there are loops in a function or not (an arrow from the bottom block to the top). Similarly, we look at the graph of the sub_401CF0 function and conclude that there are no cycles in sub_401CF0.
Probably everyone has already guessed that the two outgoing arrows from the block in the IDA Pro graph mean that this program block is part of the if-else in the source code. The color of the arrow means the following:
- Red - the path of the program execution, if the jump is not performed;
- Green - if running.
Note: usually the if-else construction after compilation turns into two instructions (at least):
- Comparison of values (this instruction will set the processor flags);
- Conditional jump based on the flags set.
0x44c The sub_401CF0 function calls two library memcmp and atoi
If we do not remember the definition and functionality of the library functions, we need to google them, as this information will allow us to understand what the analyzed code is doing. Sometimes the names of API functions may not be obvious at all, and even if you think that you know this or that function well, but there is a shadow of doubt, it is better to look at the documentation right away , in this case at memcmp.
Author's note: sometimes “fear… leads to suffering”, a long time ago, in one forgotten Galaxy, I reversed the device and, while in debug mode when loading Linux, I came across a call to the reboot function. At that moment, when the execution turned into a branch with this function, I stopped debugging and began to figure out what the problem was. Almost the entire working day was spent on all the disassembly. Finally, after looking at the reboot documentation, I read the following: "or enables / disables the reboot keystroke". Defeating "fear" and pressing F8 while on the reboot function, I realized that the device did not reboot, but continued to run ... RTFM!
It is quite easy to find that memcmp compares two arrays in memory and takes pointers of these arrays and the number of bytes to be compared as input. It seems that everything is simple and clear, but with the return value, not everything is so obvious, and newcomers to C often make a mistake. It is assumed that 0 - strings are unequal and 1 - strings are equal. In reality, if the strings are equal, the function will return 0, and if the strings are not equal, then either > 0 or < 0.
The second API function atoi converts an ascii string to an integer. Accordingly, a pointer to a string arrives at the input, and an integer value at the output.
0x44d Putting it all together and answering the two remaining questions
What conclusions can be drawn from the analysis of the use of these two API functions in the function under study?
First, memcmp checks the protocol signature (a unique sequence of bytes to "make sure" that the packet actually belongs to the given protocol). This conclusion can be made based on the fact that the buffer with the received data is passed directly to the memcmp function (try to track it yourself), the constant string “VMES” and the value 4 (obviously the length of VMES). After that, if the signature is not found, the program can turn to the branch where the value 0xFFFFFFFF (-1) is written to the eax register, or to the branch with atoi.
In this case, the memcmp function is used, not strcmp, although two strings are compared, due to the fact that you must specify the maximum signature length, 4 bytes. The strcmp function will compare until it encounters a null terminator. Although the signature "VMES" has a null terminator as the last, fifth character, in the incoming packet, the null terminator can be anywhere. Because of this, even if the package starts with this signature, strcmp will detect these lines as different.
Secondly, atoi most likely receives the length of the message body (although this does not directly follow from the analysis of only this part of the code). Take a close look and you will see that atoi takes a chunk of the buffer from the received data - four bytes after the VMES (this can be understood if you parse the assembler in the block at 0x00401D19) - and converts it to a number. The result of the atoi conversion is passed to eax. Thus, in eax at the exit from the function is either the value obtained from the received data, or -1. Also, remember that, according to the x86 calling convention, the return result of the function is in the eax register, the function checks for the signature in the first four bytes, if these bytes are not in the buffer, it returns -1, otherwise it converts the next four bytes to a number and returns it from the function. What better way to describe your code in natural language? That's right, write the code itself:
char tmp[5] = { 0 };
if (memcmp(&buf[0], "VMES", 4) != 0)
return -1;
*(int*) tmp = *(int*)(&buf[4]);
return atoi(tmp);
The code may seem strange at first. Questions may arise such as: where does the 5 byte buffer come from? Why is he here at all? Why can't you just pass to atoi (buf + 4) ? Let's start with the last question and for this we need the documentation for atoi, or rather the documentation for strtol (if you open the dock on atoi, then it refers to strtol indicating the number system 10). It says that the conversion takes place until a character is encountered that is not suitable for the given number system. That is, for the 10th system, this is any character not from the range from 0 to 9. During the reverse in such cases, it can be assumed that the author the program wanted to protect against the fact that a specially selected packet could be sent to the server, where this value will be indicated as large as you like. However, at the same time (as we will see later), he made other mistakes. As a result: copying to a separate buffer with a null terminator will avoid the problem of incorrect conversion of an ascii string.
The size of the buffer of 5 bytes can be determined by looking into the program stack (which will be discussed in more detail later in the article): in the list of function variables, the variable var_D goes right after buffer_length (therefore, they are located one after another on the stack). 0 is entered into it at the very beginning of the function, and this variable does not change in any way. Therefore var_D is the null terminator.
Based on the analysis, it is proposed to give the function a proud name x_vserv_parse_header (it has already been renamed in the screenshots).
0x45 Making "notes in the margins": sub_401BFD
; {EN} x_vserv_parse_body {EN}
0x45a A little about the stack and its frame
So, we have come to the last unparsed function in order to fully cover the "architecture" of that part of the program that is responsible for processing the protocol. As in the previous step of the reverse, you should start with her arguments. Let's turn to the block of the x_vserv_protocol function , which we previously named as PARSE_BODY (for this, as usual, you can press g , insert the block name there and press ENTER ). Before calling the function itself, two push instructions are visible, which obviously pass arguments to the sub_401BFD function we need (in the screenshots it has already been renamed to x_vserv_protocol_body ). To this end, take a look at the figure below.
What is body_buffer?
The first argument is the address (since the lea instruction is used) of a certain variable (named body_buffer in the screenshot). The second argument is what was received from the x_vserv_protocol_header function (since the eax register is passed to the push instruction unchanged). If everything is obvious with the second argument - the number after the atoi -transformation, then let's figure it out with the first one.
To understand what body_buffer is, you should pay attention to a couple of points:
- How the pointer to the buffer is obtained, which is passed to recv;
- The stack structure of the x_vserv_protocol function.
char buffer[0x1000];
Note: why is this? To answer, you need to understand what a stack frame is, and how local variables, as well as arguments, are decomposed on the stack. For details on how the data is located in the stack, it is better to read one of the links at the beginning of the article, since the topic of the stack frame itself deserves a separate article. You can also read the article on Wikipedia.
Consider the structure of the stack (frame or frame) of the x_vserv_protocol function. To display the stack frame in IDA Pro, you need to double-click on one of the variables located in the stack (the screenshots show the “red” names at the very beginning of the function). After that, you will see a picture similar to the picture below.
Function stack frame
As it was written above, the pointer for receiving data through recv corresponds to the very beginning of the stack frame (since esp is used without offset). In this regard, you can name (as usual - with the N button) the top as vmes_sign (the signature “VMES” is expected in the first four bytes).
The next four bytes are the bytes that are passed to atoi in the x_vserv_parse_header function. The conclusion about a group of four bytes can be made from the first instruction of the left block of the x_vserv_parse_header function (address 0x00401D19). The mov instruction transfers exactly four bytes from [ebx + 4] to the eax register for subsequent conversion to atoi. Since we have decided that this is the length of the body of the package, we will name them as vmes_body_len.
Now it becomes clear that after the eight described bytes are the remaining data from the TCP packet. If you were developing a client-server application, then it is obvious that this remaining data is the body of the package, and its parsing (parsing) will most likely be in the function called after x_vserv_parse_header. Actually, this function in the screenshots almost immediately was named as x_vserv_parse_body.
0x45b Parse the packet body parsing function
Let's go back to the function itself (ESC button) and put everything together. The first argument for the sub_401BFD function (x_vserv_protocol_body - you can already rename it) is the packet body, data received from the TCP socket using recv, with the exception of the first eight (apparently, the first eight are the packet header). The second argument is data located at offset +4 from the beginning of the packet (presumably the length of the packet body) and "passed" through atoi to get a number from it.
Note : if someone with knowledge of Stack BOF (aka Stack Buffer Overflow, aka Stack Buffer Overflow) decided to read the article, he probably already smelled the blood of this very buffer overflow in the stack. A value is taken from the user data and converted to a number. If there is no further validation of this data, expect overflow troubles.
It's time to look into the x_vserv_protocol_body function itself , the graph of which is shown in the figure below.
X_vserv_protocol_body function graph
After long evenings and days of reverse engineering, a ladder-style function graph almost immediately suggests that the source code contained a chain of if-else-if-else-if-else (possibly also a switch ). Indeed, if you look closely at the function, you can clearly see that the first bytes of the packet body are taken in each of the blocks and are compared in turn with “HEXDUMP”, “TALK2ME”, “B64DECO”, “DISCONN”, “STOP !!!”. If none of this was found, then the line "Unknown command" is output to the console. Thus, it is clear that the lines listed above are protocol commands. If one of them is found, execution passes to the corresponding function. They can be named as follows: x_vserv_hexdump, x_vserv_talk2me, x_vserv_b64deco, x_vserv_disconn, x_vserv_stop. These are the protocol command handlers.
0x45c Let's probe some vserv command handlers
It is interesting to note that the number that is passed as the second argument is not used directly in this function anywhere, but is only passed on to the protocol command handlers. In addition, there is no validation of the amount of received data, that is, the program believes that it must have received a packet of at least 15 bytes (although this may not be the case at all). To still make sure that the second argument, aka len, is actually a number used as the size of the data, let's turn to one of the x_vserv_hexdump handlers. The piece of function we are interested in is shown in the figure below.
Second argument x_vserv_hexdump
From this code, you can see that the function has a certain counter stored in the ebp register (probably, the compiler did not have enough general-purpose registers, usually ebp is not used as a counter). It is compared with the second argument, and the loop ends when the counter value reaches the argument, that is, whatever value we specified in the package, this loop will be executed so many times.
0x45d Rounding off for today
0x50 Is this the end?
; {EN} x_vserv_parse_body {EN}
The article is aimed at setting out in as much detail as possible the basic reverse engineering technique, which would be understandable to a beginner and he could try to study other binaries. Of course, we did not touch on the analysis of algorithms, but in fact only looked at how to understand the structure of the program and where to go after opening it in IDA Pro.
If suddenly this article turns out to be not the 9th life of a reverse engineer cat, he will talk about the analysis of the VSERV protocol handlers in IDA Pro, help write a client for it and, together with the reader, look for the RCE vulnerability (it is there and lies on the surface) in this server.
Today we got acquainted with the basics of disassembly and IDA. In the next lessons we will try our hand at practice.
Binwalk - disassembling containers and firmware
Today we will talk about a very useful tool that makes life much easier when parsing the contents of files and containers - binwalk.
For those who like to “dig deeper” and really figure out how to open various firmware of routers, IoT devices, mobile phones and other mobile-portable equipment, we recommend that you familiarize yourself with Attify OS. In addition to Binwalk, which we'll talk about today, Attify contains a set of tools designed to help security researchers analyze and identify vulnerabilities in IoT firmware and embedded devices.
IoT devices and embedded systems use firmware, which often stores a lot of useful and often critical information for an information security analyst. These can be "hardcoded" credentials, triggers for obtaining debug and system information, undocumented features, backdoors, and much more.
We'll talk about Attify another time, but for now let's return to our rams, or rather, binwalk.
This tool is positioned as a tool for analyzing firmware and searching for various constants in them that will help determine what is inside the firmware, what packaging algorithms were used, what microprocessor architecture, and much more.
It works on the basis of a signature search specified through regular expressions (you can read the source code on the github of the project - https://github.com/ReFirmLabs/binwalk.
Often binwalk is used to roughly determine which files are in a certain container or just a binary file that is difficult to attribute to any known format. Binwalk will be able to detect the merging of two files into one by displaying the signatures of both file formats. Also, he will be able to unpack the found files (you need to add the -e switch). Describing all the functions is rather dreary and pointless, the main thing is that the main purpose is clear, and you can read about all the functions in “help” or on the github. So let's get down to practice and look at a couple of examples.
Practice
Let's try using binwalk on various files.
Executable file for Linux.
Nothing interesting, I found an ELF header and a copyright line.
Let's try to run binwalk on the router firmware. Let's take the firmware for Dlink Dir 300 (link to the firmware - tyk )
We see that a data compression algorithm has been discovered - quite typical for firmware. Let's try to unpack it using the “-e” switch.
There were errors during unpacking, but the directory was created, which means that some data could be unpacked, let's see what we got.
We see 2 files and a directory (it is empty), let's see what these files are.
One file is the executable module (essentially the kernel) and the other is the file system. Let's try to determine the microprocessor architecture for the first file that the code supposedly contains.
As expected, a significant number of occurrences were found. This means that this file contains the code and the logic of the firmware, that is, you need to investigate and look for vulnerabilities in it.
binwalk can also find other important and useful information for the explorer or reverser. It is quite easy to learn and very convenient for a number of tasks. It can also be fine-tuned thanks to the Python API, but that's a topic for another post.
Outcome
This tool is quite simple and useful for analyzing containers, firmware. It will not be superfluous in the arsenal of a reverse engineer, a specialist in computer forensics and a researcher of various embedded software.
For those who are seriously interested in the topic, once again we strongly recommend that you familiarize yourself with Attify OS.